We got a lot of great feedback and kind words from our Internet friends about our writeup on the Ibanez TS-9 Tube Screamer, so my brother and I figured we should get back at it and put another guitar pedal on the bench and see what we could learn. We had a request to do a fuzz pedal and we thought that would be fun, so this time we're looking at the Catalinbread Manx Loaghtan. My understanding is that this pedal is meant to be similar to the Ram's Head Big Muff, though with a Baxandall type tone control.
In the comments we received about our previous write-up, some mention was made of looking at even- versus odd-order harmonics and the relative contribution of each to the total distortion produced, with the idea that this relationship might help quantify some of the differences in timbre that we hear produced by different effects. Luckily, the DSA we're using has the Instrument BASIC option and I was able to write a small program, EVEN-ODD.BAS, for the instrument to compute these relative contributions to total harmonic distortion from the measured power spectra. I think this was a great write-up to have this new tool available for and I appreciate the timely advice!
As before, I started with swept-sine frequency response measurements to characterize the operation of the bass and treble controls. After that, I moved on to take distortion measurements with a fixed-sine input to characterize the sustain control. I noticed some unexpected interaction between the tone controls and the distortion product blend and that this interaction depended as well on the supply voltage. I thought this interaction was interesting, so I made some additional measurements to try to characterize it.
I was able to use essentially the same instrument setup for these measurements as I did for the Tube Screamer measurements, with the exception that for certain measurements the power supply voltage was adjusted as noted below. The DSA configurations for frequency response and distortion measurements are available as FREQRESP.STA and DISTORTN.STA.
I started out with a quick measurement of current draw, something I now wish I had measured on the TS-9 as well. I found that, at least when powered from the external power jack, the pedal draws 2.18mA at 9 Volts even when switched off. When switched on, the current increases to 2.91mA. I imagine most or all of the increase is accounted for by the LED lighting up. A typical alkaline 9V battery has a capacity of about 600mAh at low currents like this and so should be good for something like 20 hours of use, though the supplied voltage may be quite low (perhaps 5 Volts) at the end.
I suspected a true-bypass switching arrangement on a boutique pedal like this, but made a quick frequency response measurement with the pedal switched off to check. The measurement confirmed my suspicion: dead flat response across the measurement range. I saved this trace as FRBYPASS.DAT.
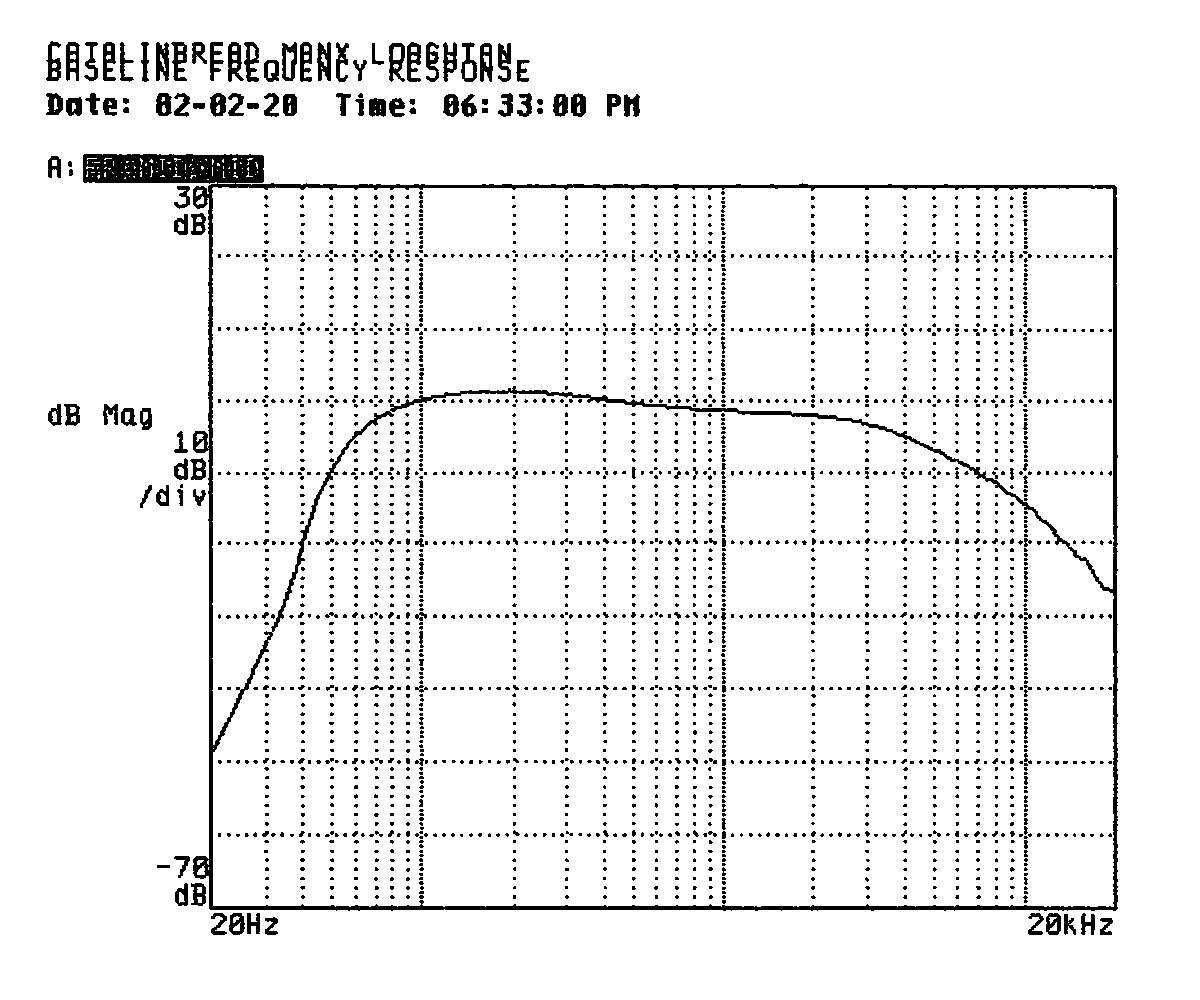
I switched the pedal on and took a baseline frequency response measurement with both the treble and bass controls at their middle positions. This showed a more or less flat response between 78 and 3,800Hz, though the bass response was a little higher and technically rolled off 3dB from its peak by 1.3kHz. I think with some knob tweaking, you could dial this in as flat as you please.
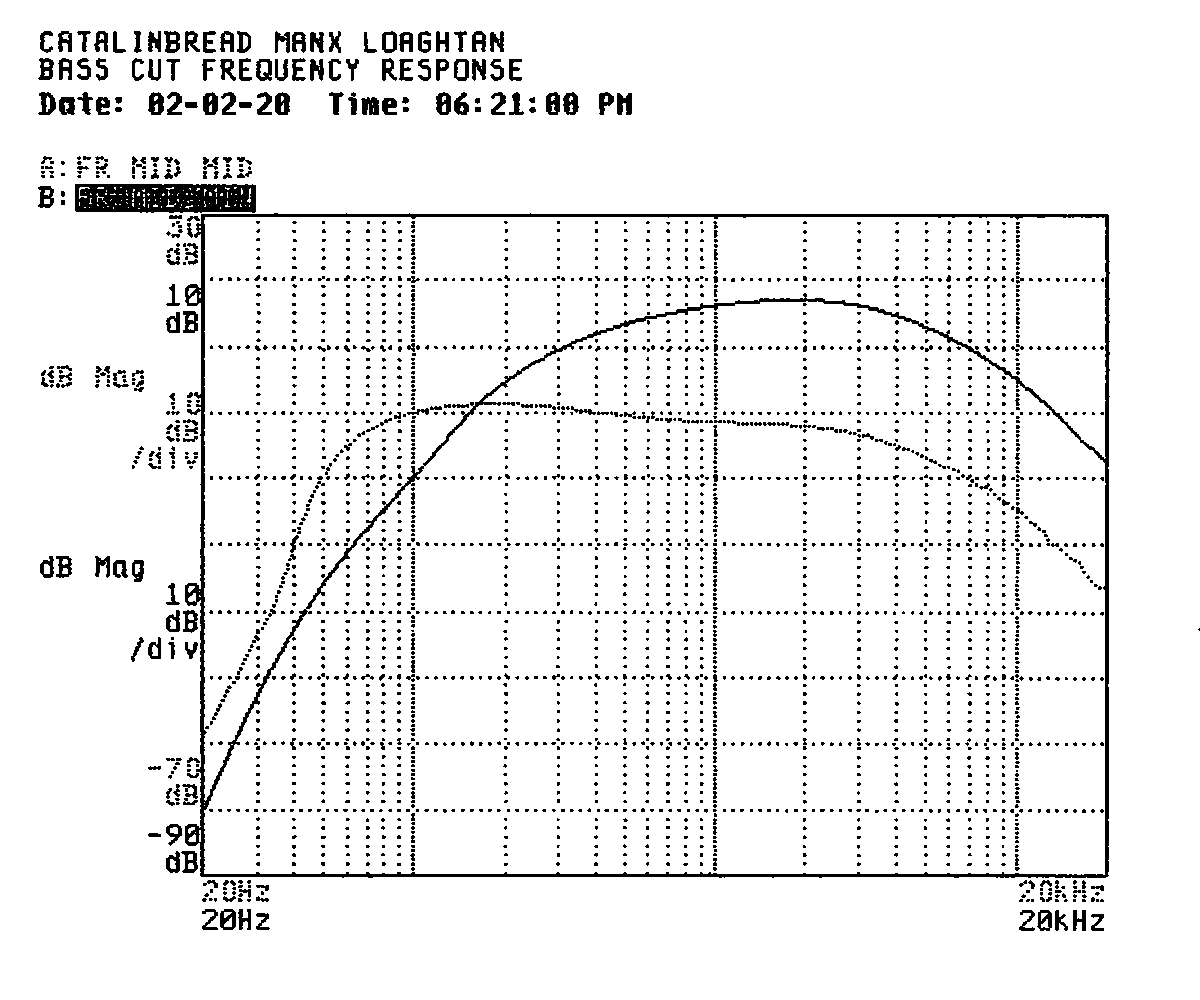
Turning the bass knob all the way down rolled the bass off smoothly below 580Hz. Sorry I spaced out on matching scales in the print below; the response with this setting peaks at about the same level in the treble region as the baseline, it just looks higher because the top of the scale is down 20dB, as you can see in the scale labels.
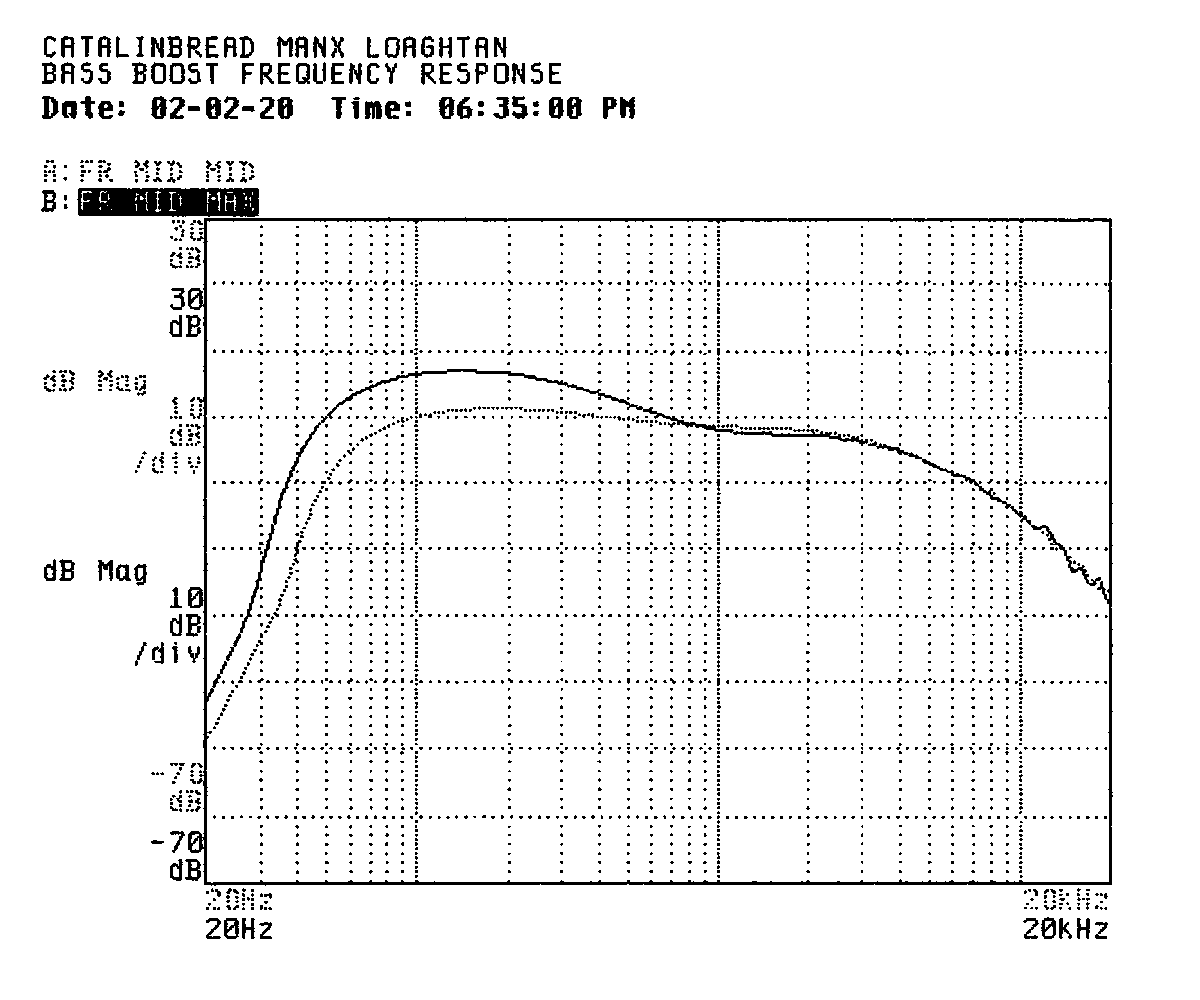
Turning the bass knob all the way up gave a less-pronounced but still respectable boost to the bass frequencies down to 66Hz.
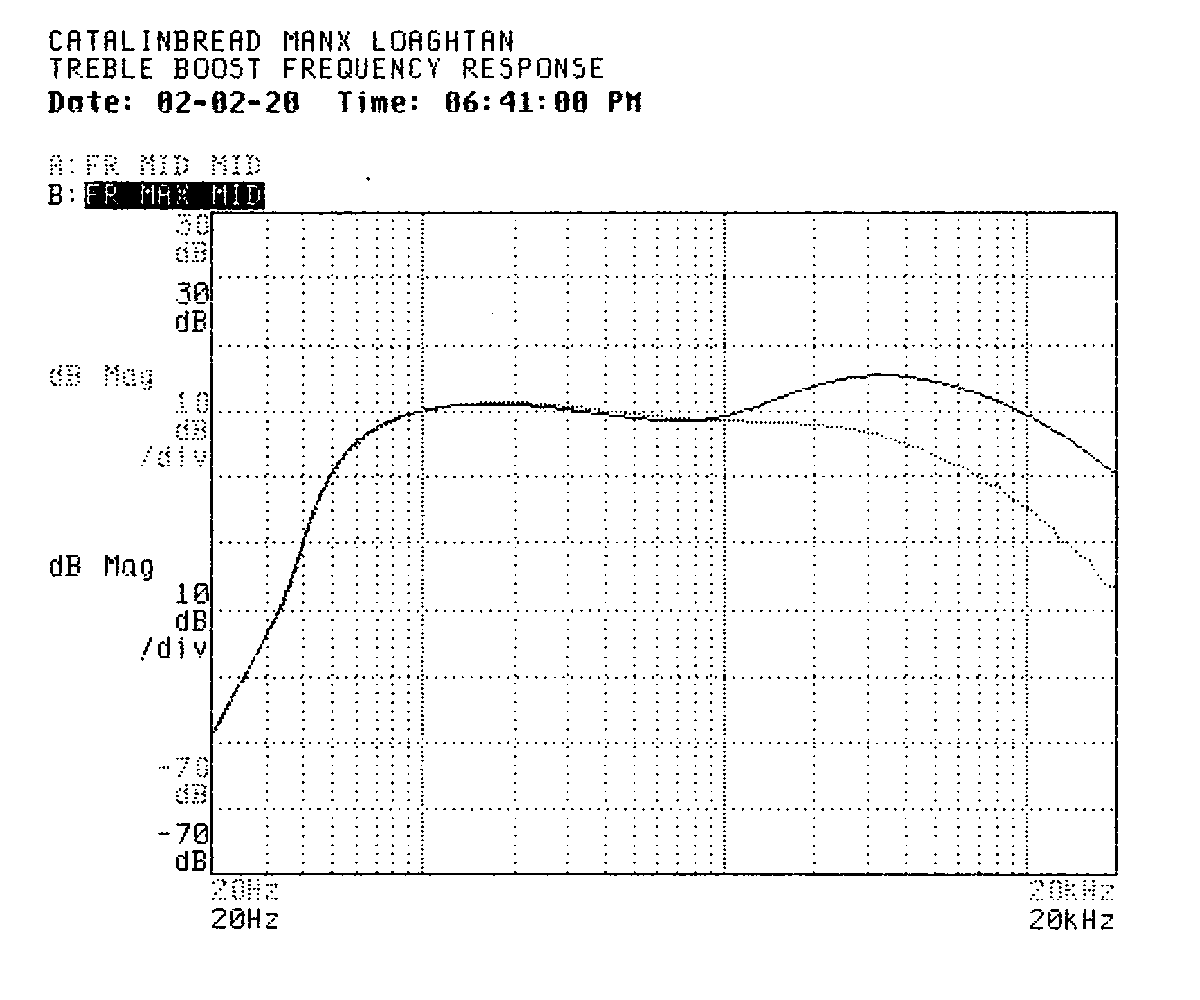
I tried the treble boost next. Turning that knob all the way up gives a more pronounced boost than the bass knob did, out to about 7.2kHz.
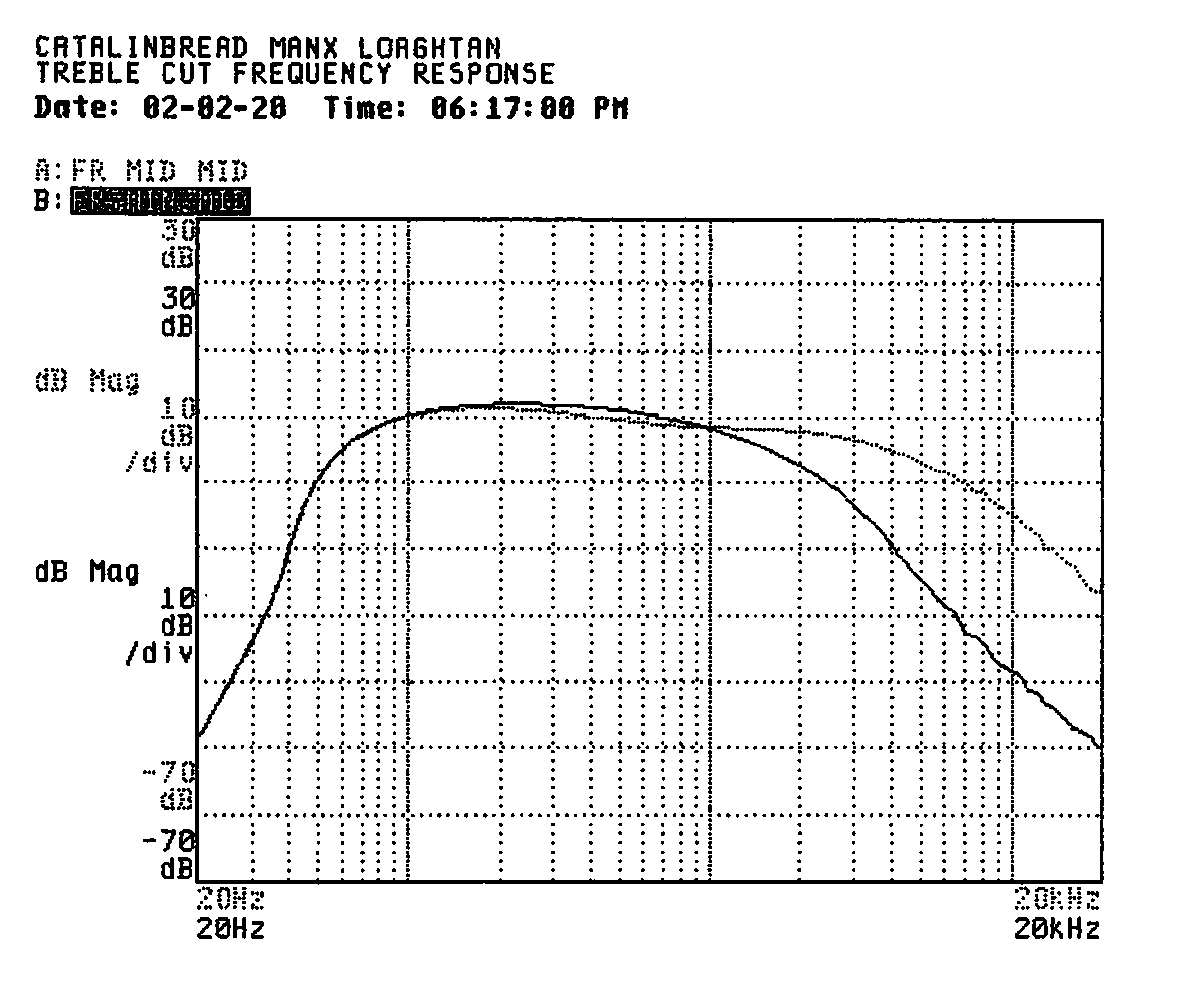
Turning the treble knob all the way down resulted in high frequencies rolling off from about 910Hz.
I took complete measurements at each combination of treble and bass at their minimum, middle, and maximum settings. I used the DSA's marker feature to measure the peak response and find the -3dB corner frequencies of the resulting pass-band. For some measurements, a little dip in the mid-range created two peaks in the pass-band. In these cases, I measured 3dB down from the highest peak and also 3dB down from the lower peak. The corner frequency of the lower peak is in parentheses. With both knobs in their maximum positions, the mid-scoop was pronounced and I broke out separate measurements for the bass peak, mid scoop, and treble peak on this setting.
| Treble setting | Bass setting | Peak response | Corner frequencies | Data file |
|---|---|---|---|---|
| Minimum | Minimum | -5.4dB | 360 to 1,800Hz | FRMINMIN.DAT |
| Minimum | Middle | 2.3 | 81 to 910 | FRMINMID.DAT |
| Minimum | Maximum | 7.8 | 68 to 425 | FRMINMAX.DAT |
| Middle | Minimum | -2.4 | 580 to 4,400 | FRMINMID.DAT |
| Middle | Middle | 1.7 | 78 to 1,300 (3,800) | FRMIDMID.DAT |
| Middle | Maximum | 7.5 | 66 to 370 (2,900) | FRMIDMAX.DAT |
| Maximum | Minimum | 6.6 | 1,400 to 6,700 | FRMAXMIN.DAT |
| Maximum | Middle | 5.8 | (74) 1,600 to 7,200 | FRMAXMID.DAT |
| Maximum | Maximum | three segments, detailed below | FRMAXMAX.DAT | |
| Bass peak | 7.2 | 65 to 360 | ||
| Mid scoop | -2.9 | 600 to 1,400 | ||
| Treble Peak | 5.7 | 1,800 to 7,300 | ||
Next, I turned my attention to distortion measurements. I wanted to investigate the effect adjusting the sustain knob would have on the overall output level and distortion products at various input levels. In each set of measurements, the output level stayed the same until the input level fell below a certain threshold, then it fell along with the input level. True to it's label, the sustain knob adjusted where this point fell: high output would be maintained at lower and lower input levels the greater the sustain setting.
I noticed that even-order distortion was most pronounced at the highest and lowest input levels, with the least amount of even-order distortion products near the input level above which the output level stopped changing. This showed what I thought was an interesting effect: though the output level stayed the same as the input signal fell off, the character of the distortion changed smoothly throughout the process.
| Source | Fundamental | Distortion | File | ||
|---|---|---|---|---|---|
| Even-order | Odd-order | Total | |||
| -70 dBVRMS | -45 dbVRMS | 10% | 1% | 10% | DMIN70.DAT |
| -50 | -18 | 26 | 6 | 27 | DMIN50.DAT |
| -30 | -7 | 9 | 28 | 29 | DMIN30.DAT |
| -10 | -4 | 10 | 38 | 39 | DMIN10.DAT |
| -5 | -4 | 12 | 39 | 41 | DMIN5.DAT |
| 0 | -3 | 24 | 37 | 44 | DMIN0.DAT |
| Source | Fundamental | Distortion | File | ||
|---|---|---|---|---|---|
| Even-order | Odd-order | Total | |||
| -70 dBVRMS | -26 dBVRMS | 29% | 1% | 29% | DMID70.DAT |
| -50 | -9 | 11 | 21 | 24 | DMID50.DAT |
| -30 | -5 | 8 | 36 | 37 | DMID30.DAT |
| -10 | -3 | 11 | 41 | 42 | DMID10.DAT |
| -5 | -3 | 13 | 41 | 43 | DMID5.DAT |
| 0 | -3 | 25 | 37 | 44 | DMID0.DAT |
| Source | Fundamental | Distortion | File | ||
|---|---|---|---|---|---|
| Even-order | Odd-order | Total | |||
| -70 dBVRMS | -9 dBVRMS | 11% | 17% | 21% | DMAX70.DAT |
| -50 | -5 | 8 | 35 | 36 | DMAX50.DAT |
| -30 | -3 | 10 | 41 | 42 | DMAX30.DAT |
| -10 | -4 | 19 | 41 | 45 | DMAX10.DAT |
| -5 | -4 | 25 | 36 | 44 | DMAX5.DAT |
| 0 | -5 | 50 | 34 | 61 | DMAX0.DAT |
In taking these distortion measurements, I noticed what I thought might be an unusual arrangement of distortion products in the frequency-domain plots. Particularly, I considered the irregular fall-off in odd-order distortion products and increase in even-order products suggestive of some asymmetry that might be neat to look at in the time domain.
For example, we can see in the frequency-domain plot below a significant proportion of even-order distortion products and some irregularity in their distribution.
And here's the corresponding time-domain trace. It's not too wild yet, but the assymetry is apparent even in this trace. In my notes, I marked this type of trace down as “square... ish”.
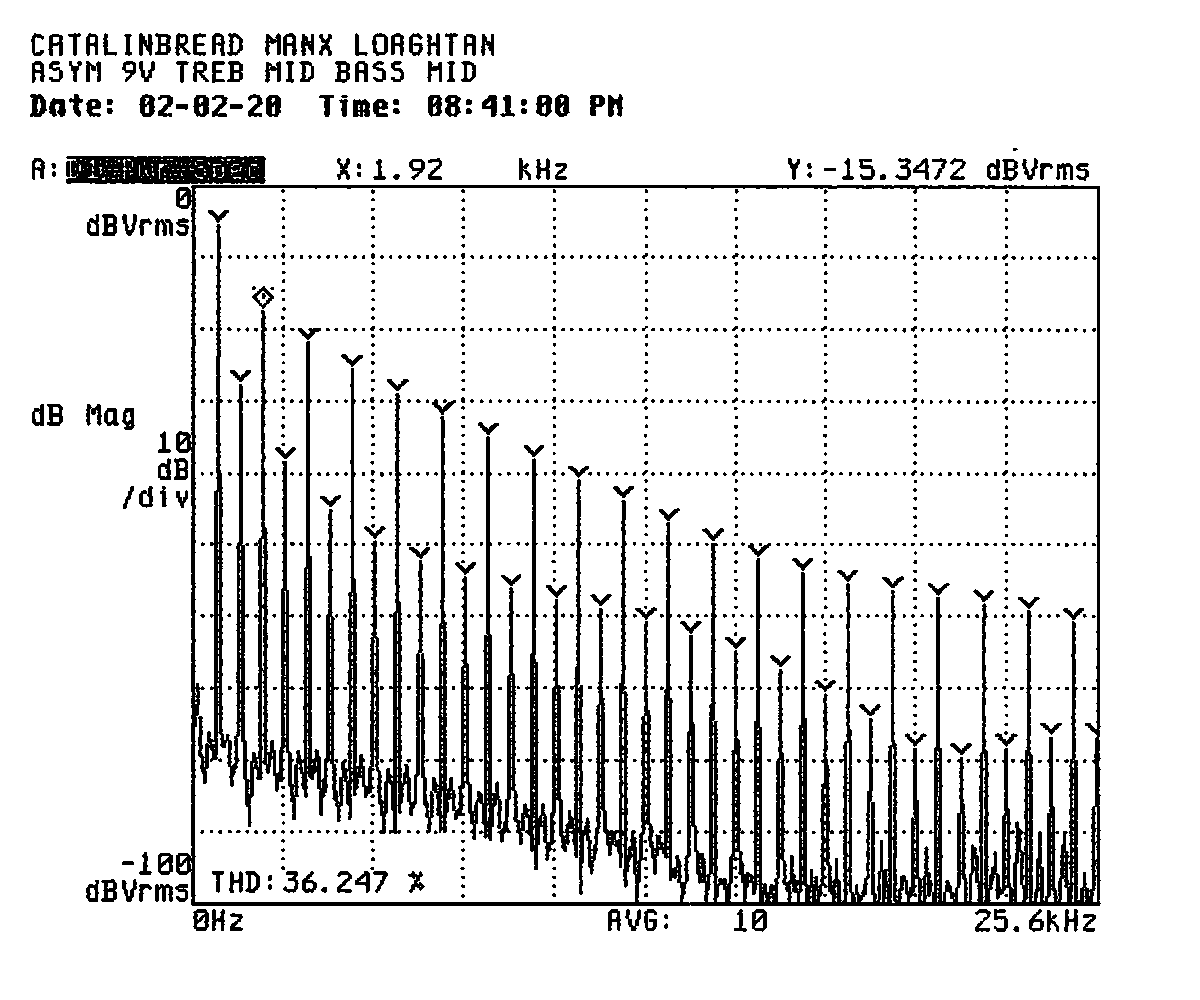
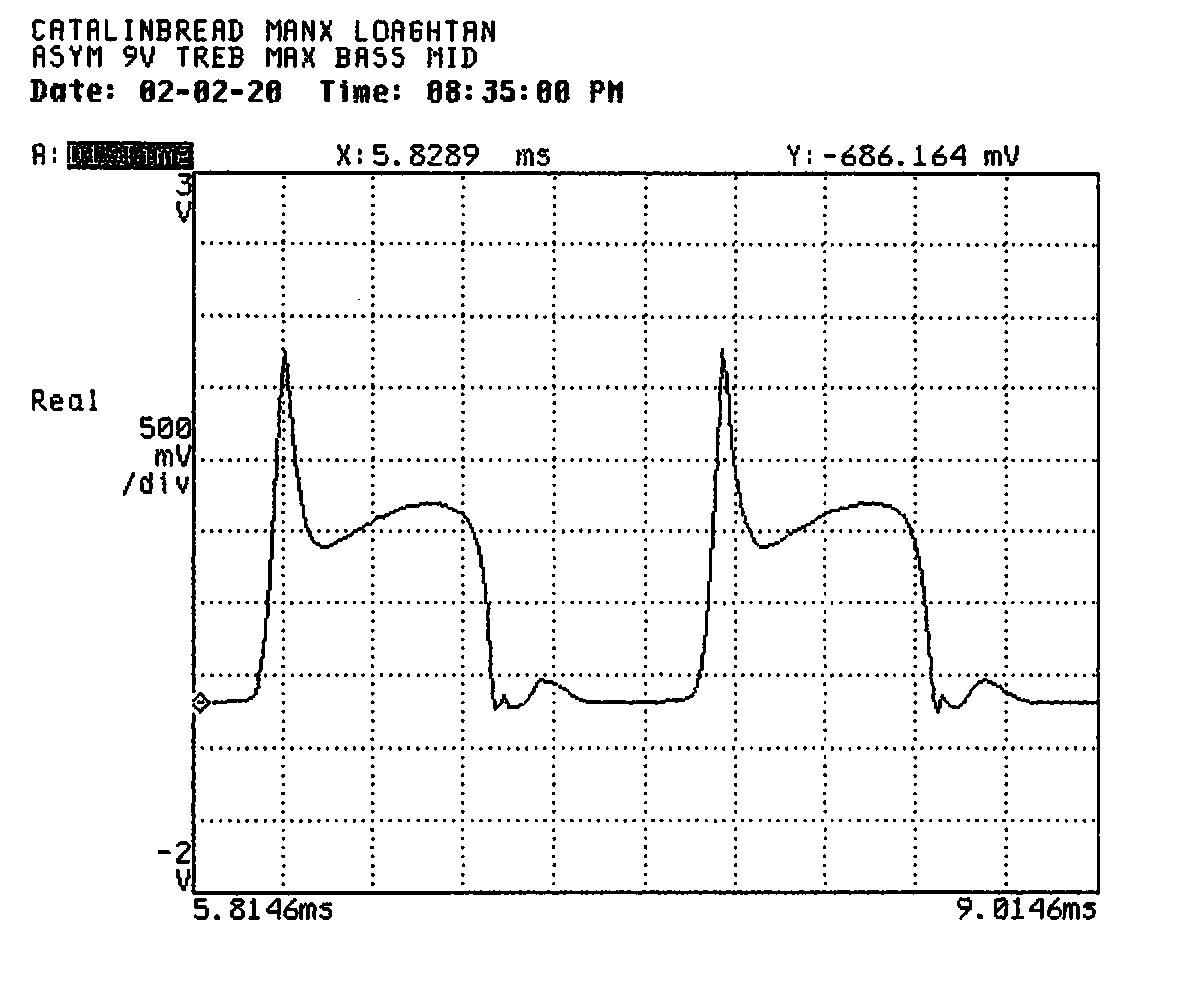
With the treble control at maximum, this frequency-domain plot shows the sort of thing that really got my interest. Even-order disortion products dominate for a significant portion of the plot.
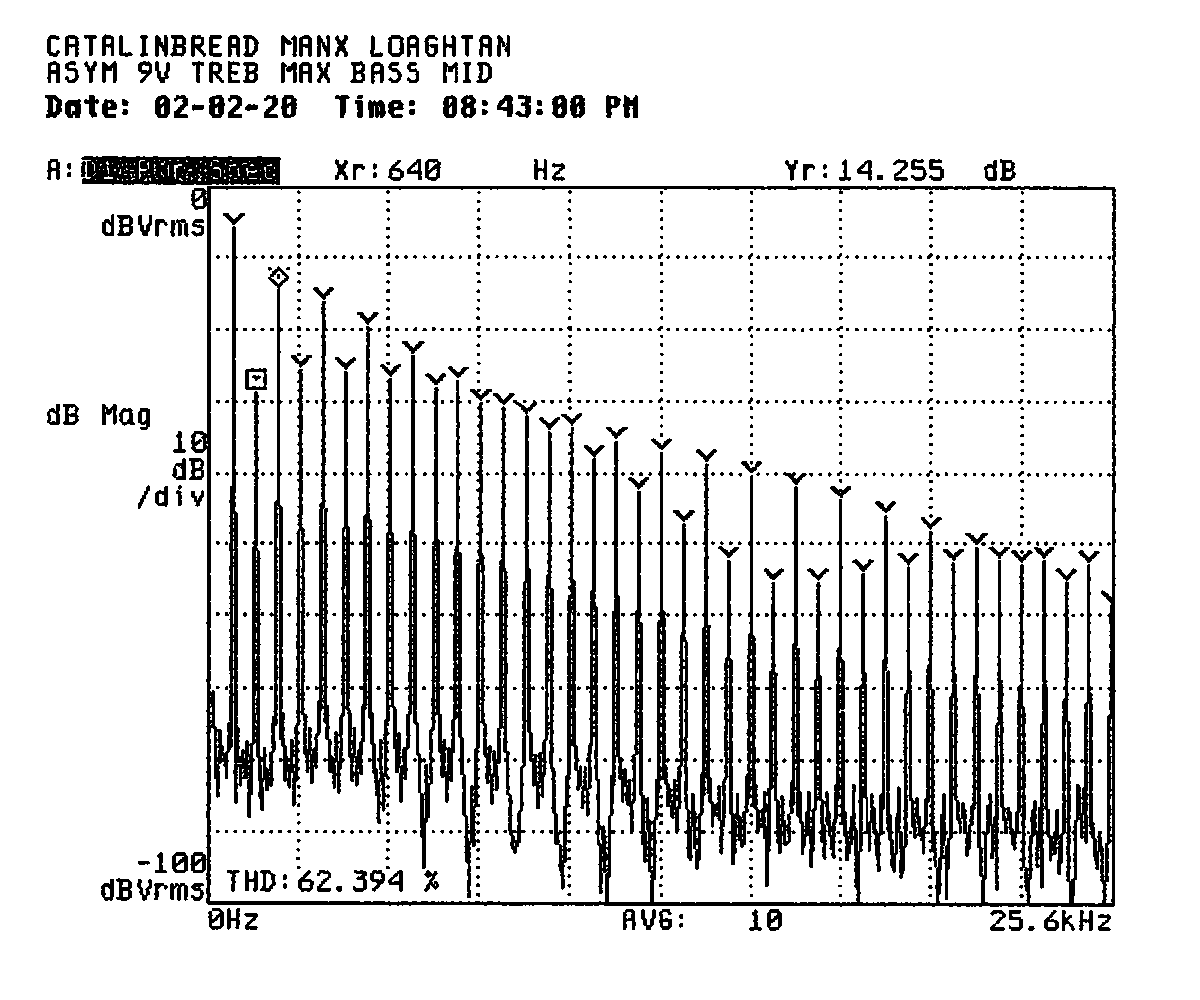
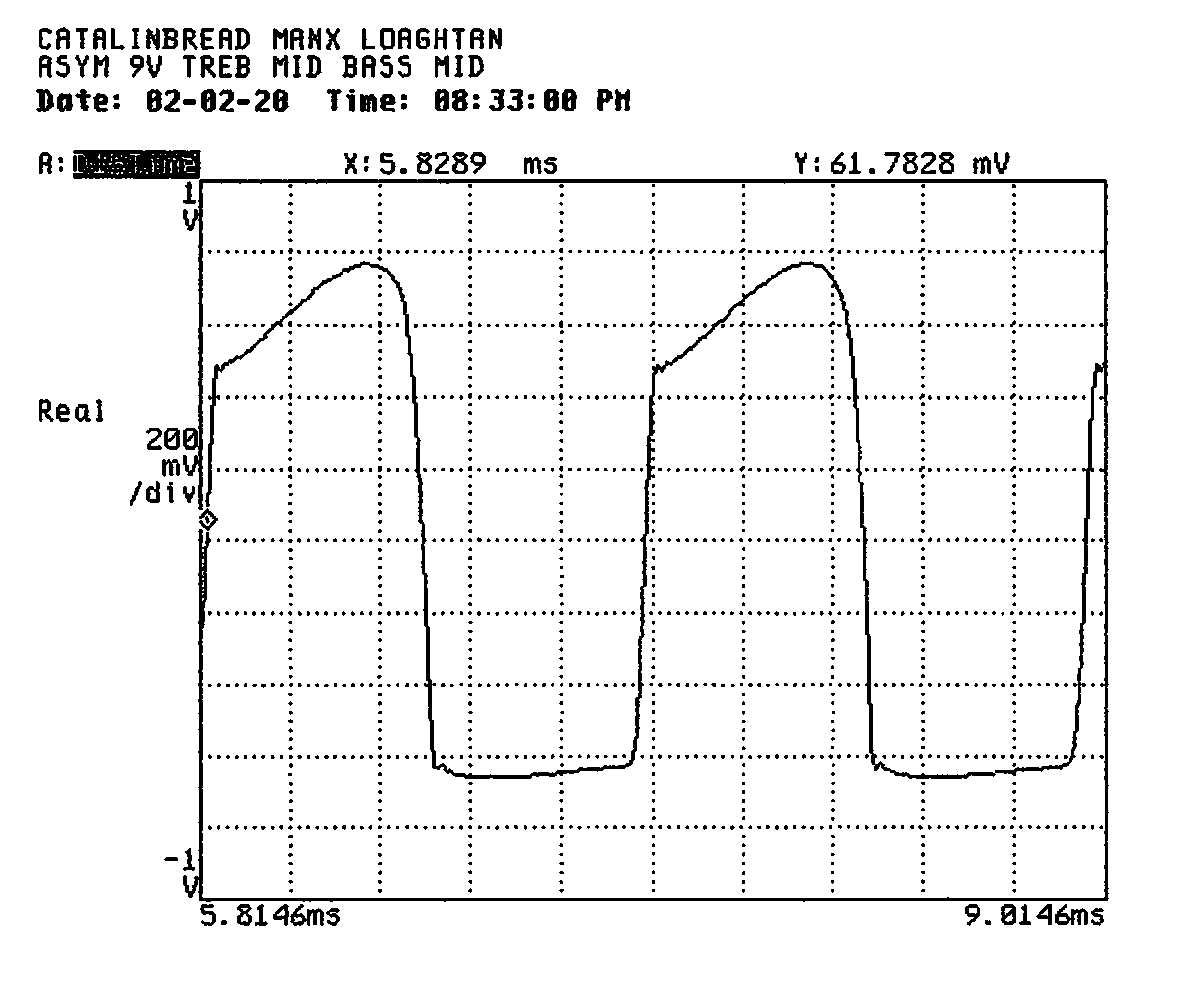
As you might expect, the time-domain trace bears little resemblance to the input sine wave. In my notes I called this sort of trace “giraffes” due to the pronounced overshoot on the rising edge.
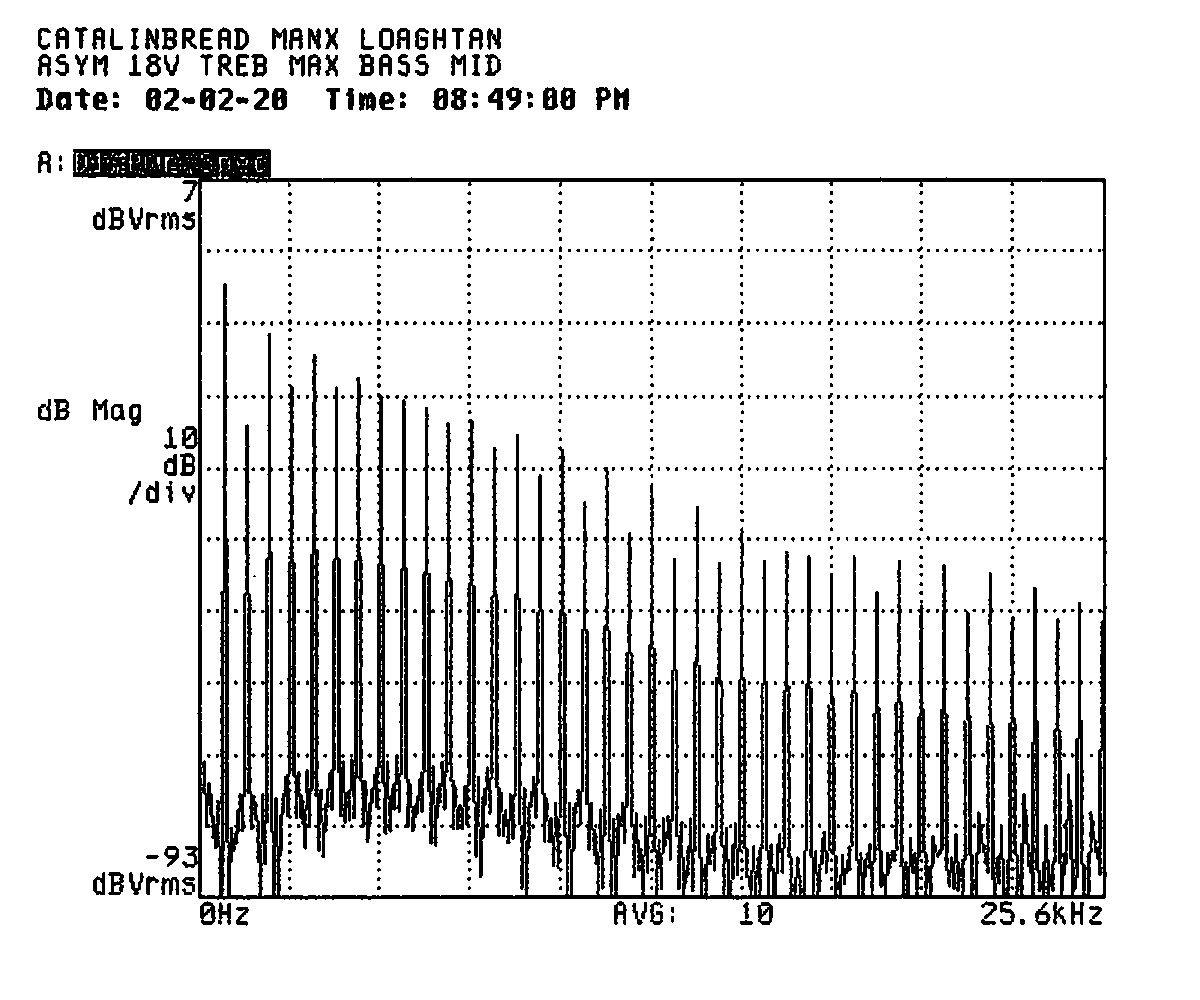
Doubling the supply voltage to 18V gave a significant increase in even-order distortion products for these same settings on the pedal, as can be seen in this frequency-domain plot (sorry I forgot to put the harmonic markers on this one).
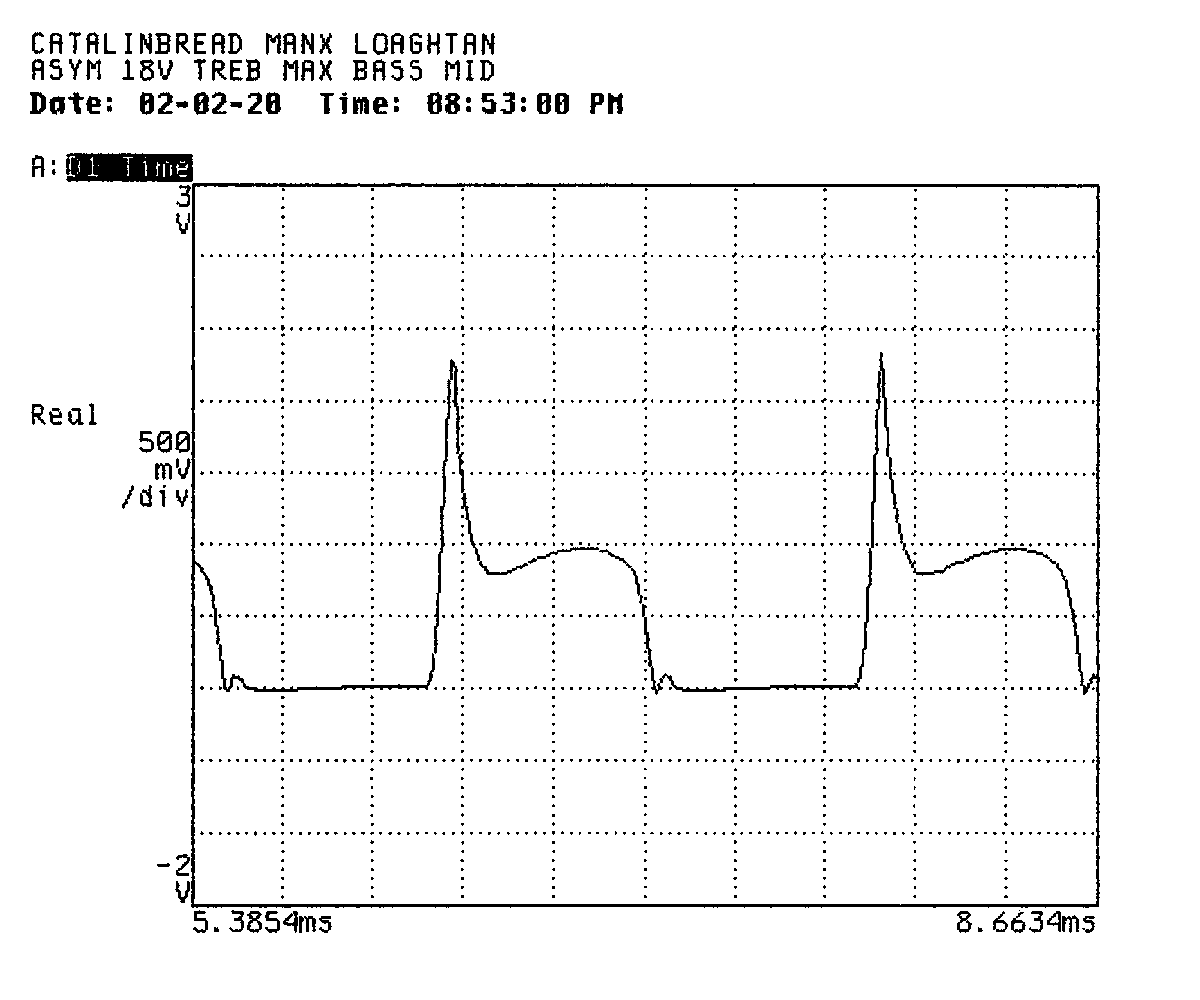
In the time-domain, the trace looks similar to the one taken at 9V, with a bit less ringing on the negative-going side. I think this helps highlight the value of frequency-domain plots for distortion measurement. It can be hard to judge from a time-domain trace the relative contributions of different harmonics or the relative degree of distortion (except in the case of gross differences).
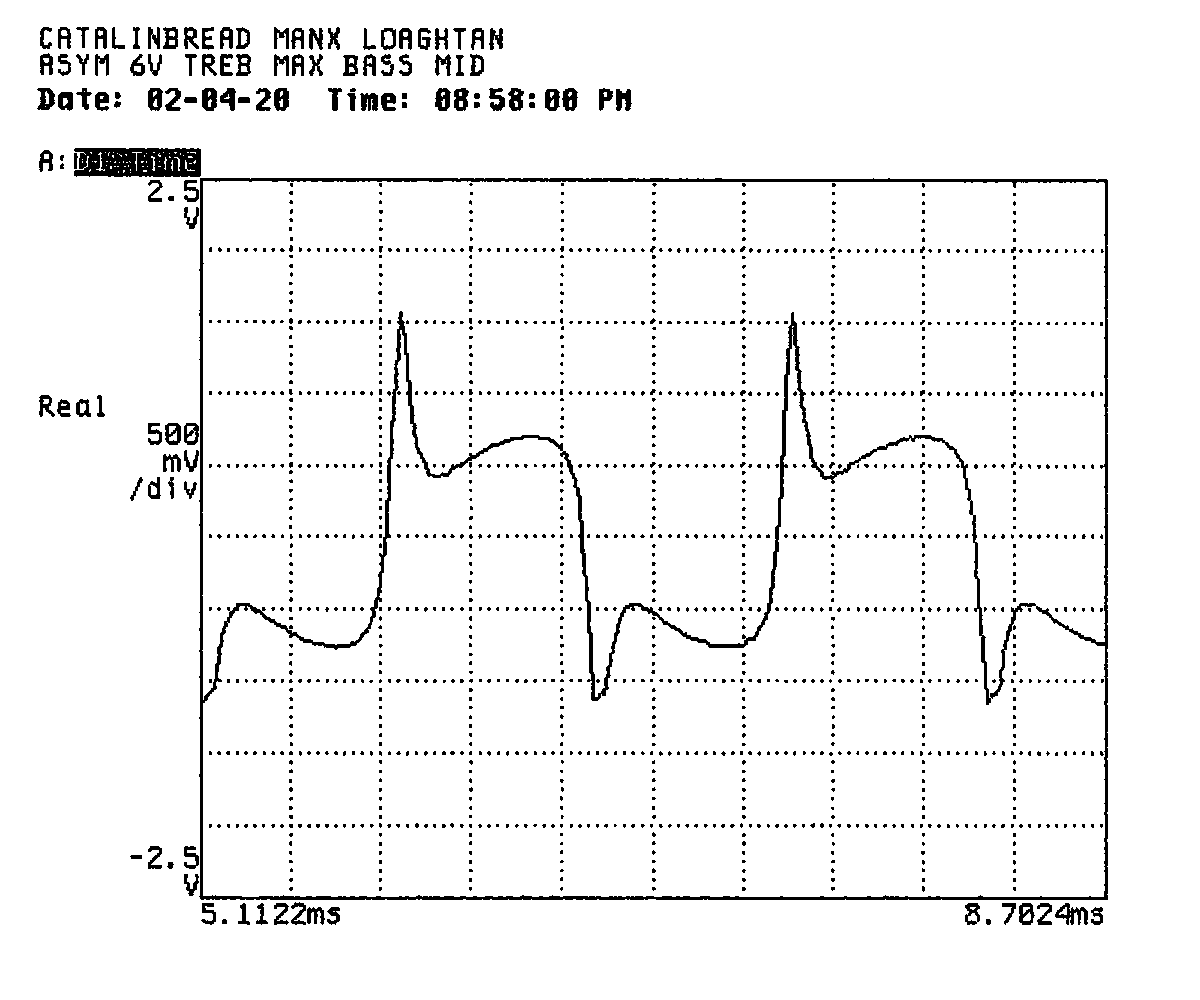
Lowering the supply voltage to 6V showed a significant reduction in even-order distortion products, particularly in the lower harmonics. They still dominate by the time we get to the right edge of the plot, as you can see below.
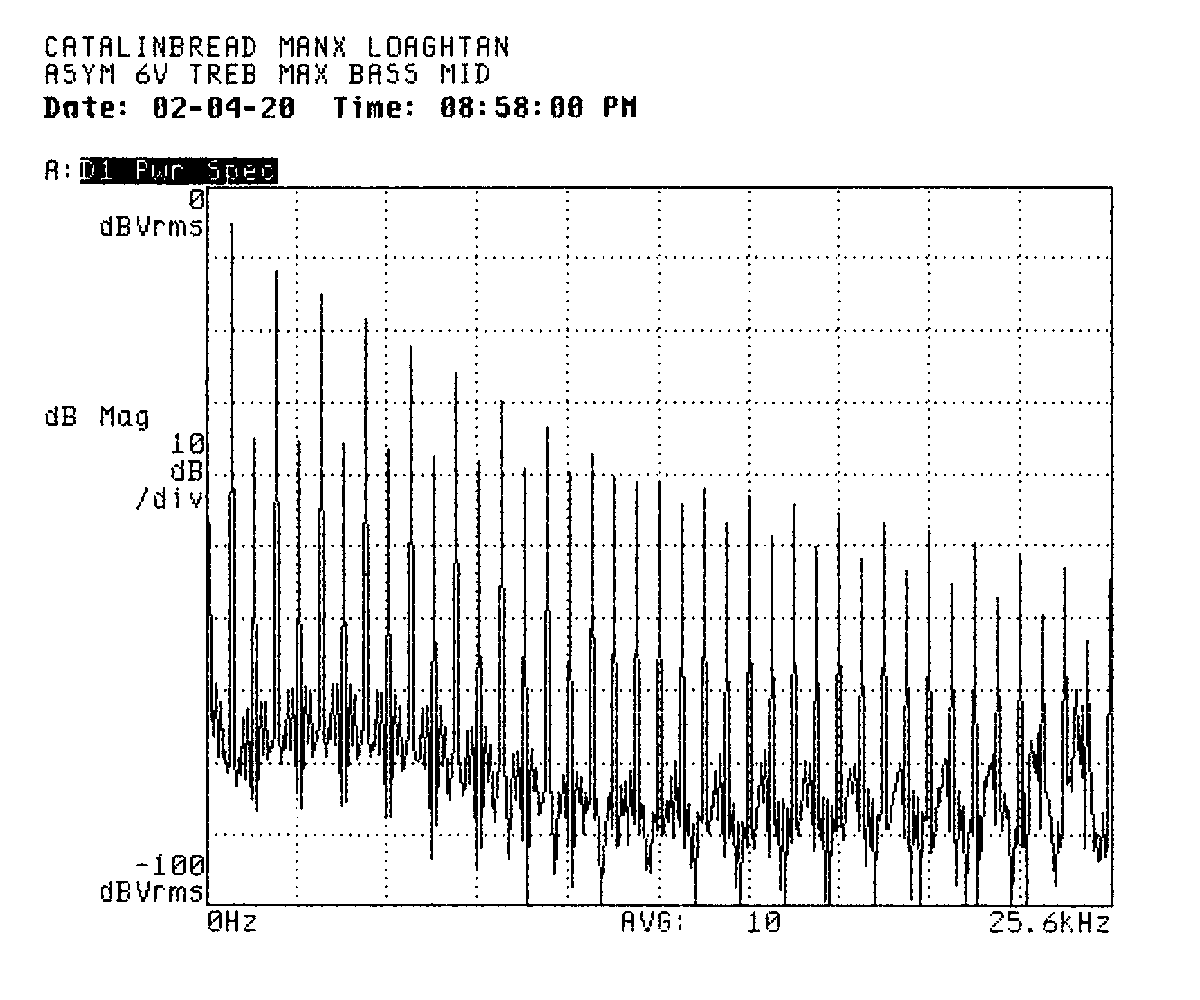
Flipping to the time domain, we still see a pretty wild trace, but the positive- and negative-going portions are somewhat more symmetrical than when the power supply was set to 18V or 9V.
I performed a comprehensive survey of the effect of different tone settings on the distribution (even vs. odd) of distortion products and how this effect varied with supply voltage. These measurements were taken with the sustain control set to the middle and an input level of -30dBVRMS.
| Treble | Bass | Waveform | Distortion | Files | ||
|---|---|---|---|---|---|---|
| Even | Odd | Total | ||||
| Minimum | Minimum | Symmetrical sawtooth | 1% | 24% | 24% | A6MINMIN.DAT
B6MINMIN.DAT |
| Minimum | Middle | Symmetric sawtooth | 1 | 16 | 16 | A6MINMID.DAT
B6MINMID.DAT |
| Minimum | Maximum | Sawtooth... ish | 2 | 11 | 12 | A6MINMAX.DAT
B6MINMAX.DAT |
| Middle | Minimum | Symmetric sails | 3 | 45 | 45 | A6MIDMIN.DAT
B6MIDMIN.DAT |
| Middle | Middle | Square... ish | 1 | 33 | 33 | A6MIDMID.DAT
B6MIDMID.DAT |
| Middle | Maximum | Symmetric sawtooth | 2 | 26 | 27 | A6MIDMAX.DAT
B6MIDMAX.DAT |
| Maximum | Minimum | Peaks | 15 | 77 | 79 | A6MAXMIN.DAT
B6MAXMIN.DAT |
| Maximum | Middle | Giraffes | 8 | 64 | 65 | A6MAXMID.DAT
B6MAXMID.DAT |
| Maximum | Maximum | Camels | 4 | 62 | 62 | A6MAXMAX.DAT
B6MAXMAX.DAT |
| Treble | Bass | Waveform | Distortion | Files | ||
|---|---|---|---|---|---|---|
| Even | Odd | Total | ||||
| Minimum | Minimum | Reverse sawtooth | 18% | 24% | 30% | A9MINMIN.DAT
B9MINMIN.DAT |
| Minimum | Middle | Sawtooth | 10 | 19 | 21 | A9MINMID.DAT
B9MINMID.DAT |
| Minimum | Maximum | Sawtooth | 12 | 11 | 17 | A9MINMAX.DAT
B9MINMAX.DAT |
| Middle | Minimum | Sails | 28 | 36 | 45 | A9MIDMIN.DAT
B9MIDMIN.DAT |
| Middle | Middle | Square... ish | 8 | 35 | 36 | A9MIDMID.DAT
B9MIDMID.DAT |
| Middle | Maximum | Sawtooth | 13 | 24 | 27 | A9MIDMAX.DAT
B9MIDMAX.DAT |
| Maximum | Minimum | Sails | 43 | 71 | 83 | A9MAXMIN.DAT
B9MAXMIN.DAT |
| Maximum | Middle | Giraffes | 22 | 58 | 62 | A9MAXMID.DAT
B9MAXMID.DAT |
| Maximum | Maximum | Camels | 15 | 61 | 63 | A9MAXMAX.DAT
B9MAXMAX.DAT |
| Treble | Bass | Waveform | Distortion | Files | ||
|---|---|---|---|---|---|---|
| Even | Odd | Total | ||||
| Minimum | Minimum | Reverse sawtooth | 61% | 24% | 66% | AHMINMIN.DAT
BHMINMIN.DAT |
| Minimum | Middle | Sawtooth | 27 | 21 | 34 | AHMINMID.DAT
BHMINMID.DAT |
| Minimum | Maximum | Sawtooth | 30 | 16 | 34 | AHMINMAX.DAT
BHMINMAX.DAT |
| Middle | Minimum | Sails | 83 | 49 | 96 | AHMIDMIN.DAT
BHMIDMIN.DAT |
| Middle | Middle | Square... ish | 16 | 36 | 40 | AHMIDMID.DAT
BHMIDMID.DAT |
| Middle | Maximum | Sawtooth | 33 | 32 | 46 | AHMIDMAX.DAT
BHMIDMAX.DAT |
| Maximum | Minimum | Sails | 124 | 88 | 152 | AHMAXMIN.DAT
BHMAXMIN.DAT |
| Maximum | Middle | Giraffes | 41 | 64 | 75 | AHMAXMID.DAT
BHMAXMID.DAT |
| Maximum | Maximum | Camels | 40 | 63 | 75 | AHMAXMAX.DAT
BHMAXMAX.DAT |
The net of these measurements seems to be that the tone settings have a significant impact on harmonic production. That is to say, they don't seem to merely shape the output of the disortion circuit, but rather appear to interact with it directly. Anecdotally, I've heard that some folks find it tricky to dial in a pleasing tone with this effect. I wonder if this interaction may have something to do with that.
In summary, the Catalinbread Manx Loaghtan appears to be an interesting variation on a classic fuzz circuit. The Baxandall style tone-control provides broad tone shaping and shows some curious interaction with the distortion circuit. Furthermore, the effect seems to respond to changes in power supply voltage in a way that may be musically interesting.
I hope you found this write-up interesting and helpful. If you have any questions or comments, please let me know! If this is the kind of thing you're into, you may enjoy our other work.
Aaron D. Parks