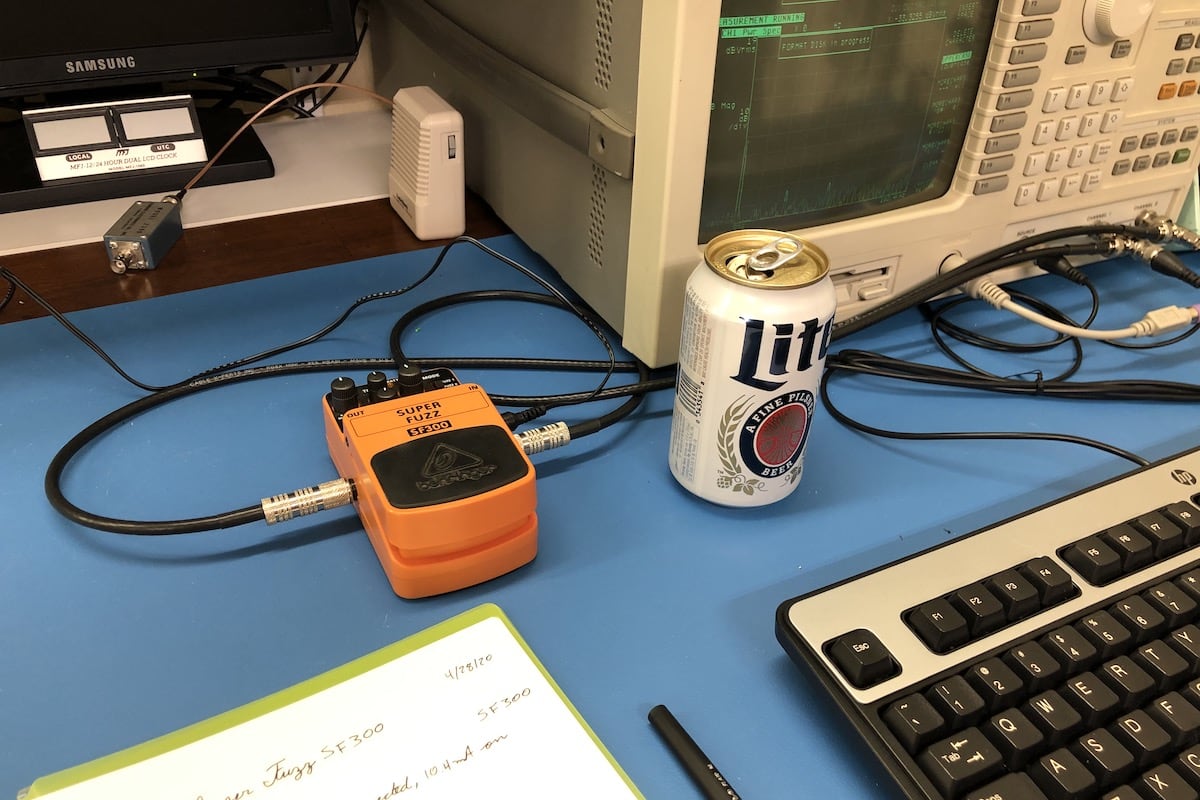
One Internet reviewer says of the Behringer Super Fuzz that “the primary purpose of this pedal [...] is to bludgeon the listener.” I thought we'd better get it on the bench and see if it can bludgeon the dynamic signal analyzer.
My initial impression from handling the pedal is that it has been inexpensively made: the plastic is plasticky and the knobs are kind of sad. On closer inspection, I was actually kind of delighted by what appears to have been a comprehensive exercise in cost-engineering. I guess I'm that kind of nerd.
I was able to use essentially the same instrument setup for these measurements as I did for the Tube Screamer measurements. The DSA configurations for frequency response and distortion measurements are available as FREQRESP.STA and DISTORTN.STA.
The pedal was connected to a bench power supply set to 9 Volts. With the input jack disconnected, the pedal drew no measurable current. With the input jack connected to the DSA, it drew 8.7 mA and with the effect turned on it drew 10.4 mA.
I started out with a frequency response measurement with the pedal turned off. Since the stomp switch seems to be momentary, I supposed that the pedal might use buffered bypass. I was surprised to find a flat frequency response with the effect disabled. FBYPASS.DAT
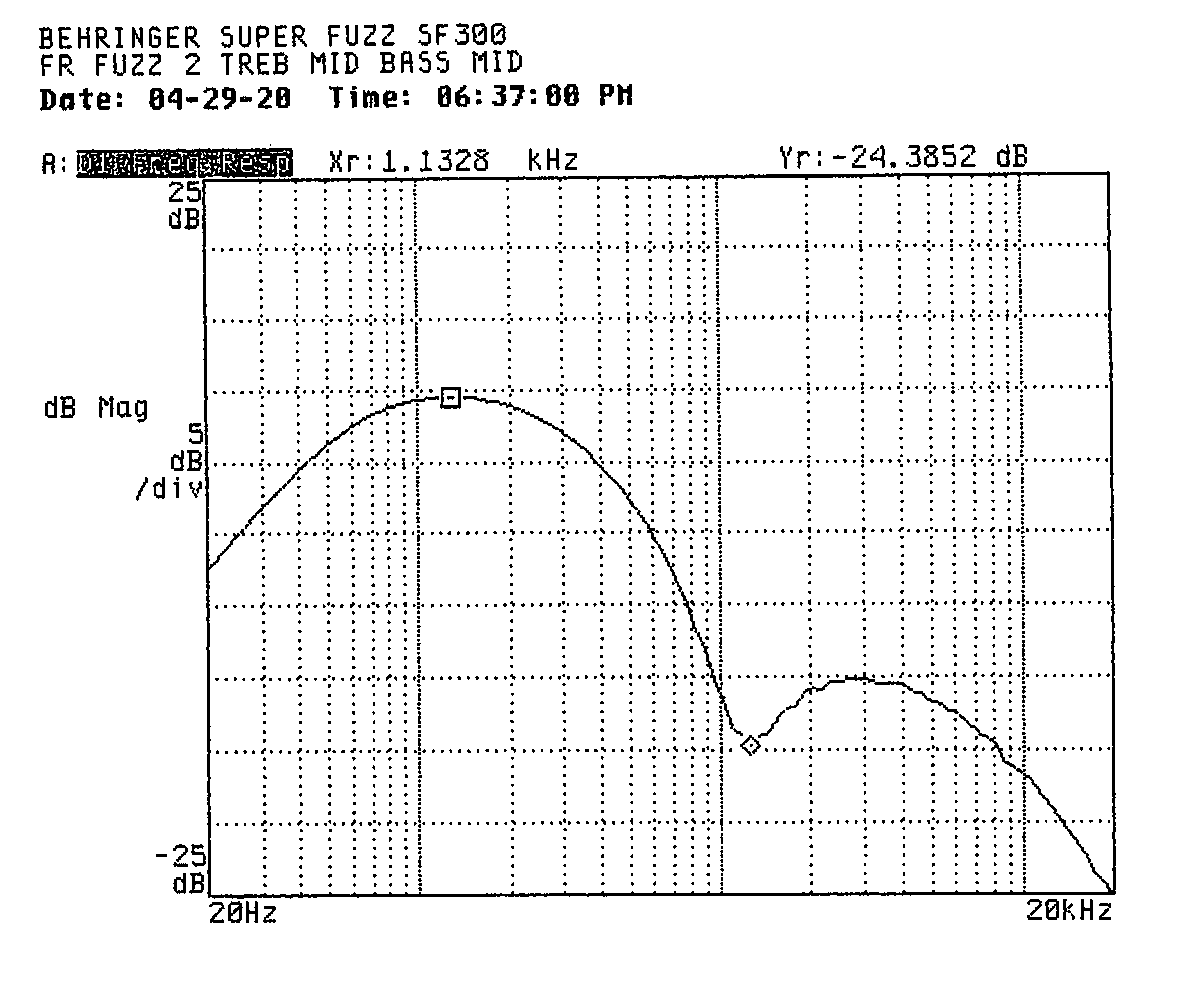
The effect has three different modes as well as some adjustments, so I settled in for some comprehensive frequency response measurements. In both the Fuzz 1 and Fuzz 2 modes, the bass control seems to boost or cut the response around 115 Hz while the treble control seems mostly to increase or decrease the cutoff frequency on the high end. In Fuzz 2 mode there's also a second (much lower) treble peak that becomes more prominent and moves up in frequency as the treble control is increased.
| Treble | Bass | Low scoop/peak | High cutoff | File |
|---|---|---|---|---|
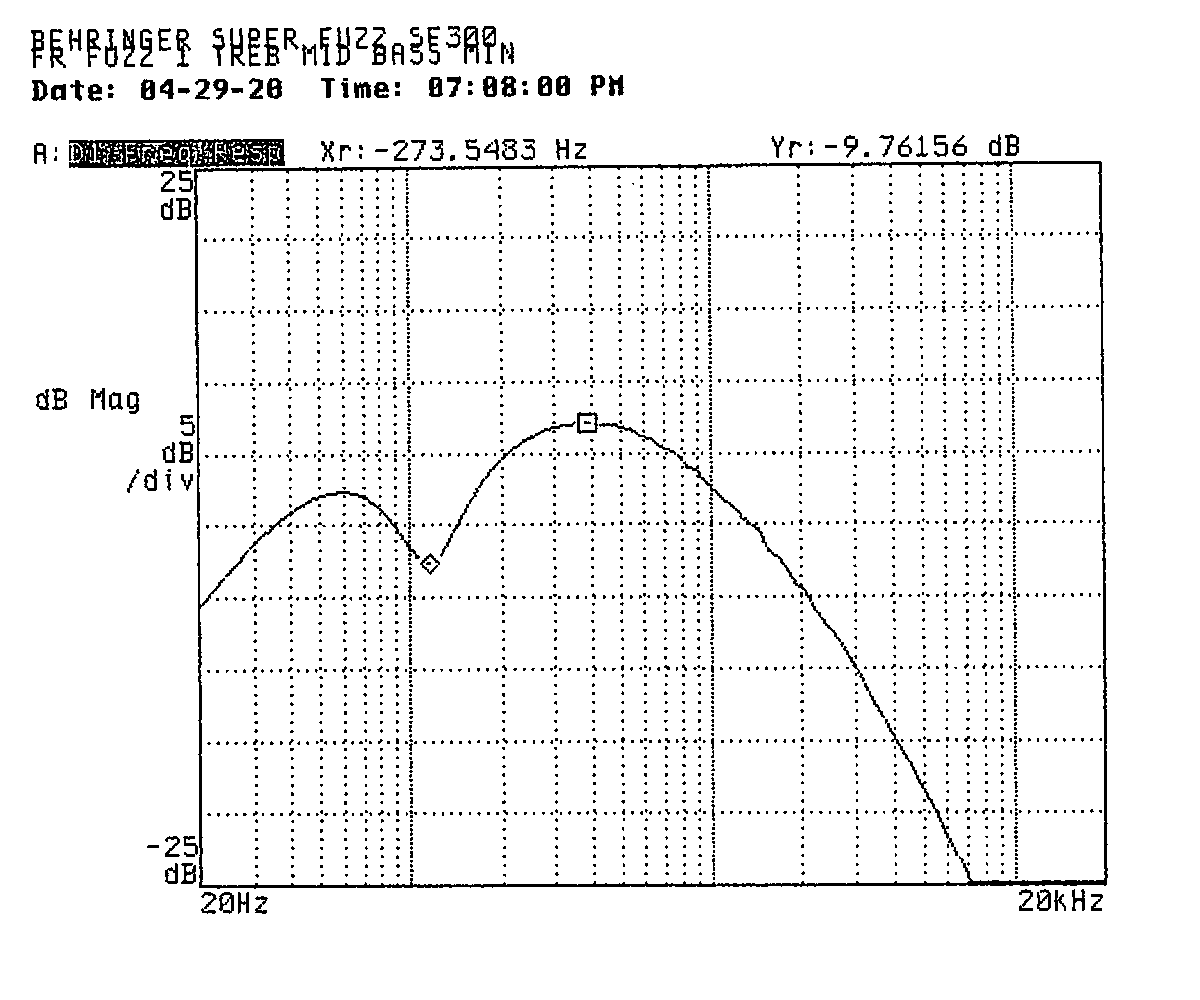
| Minimum | Minimum | -9.6 dBVRMS at 112 Hz | 690 Hz | F1MINMIN.DAT |
| Minimum | Middle | — | 590 | F1MINMID.DAT |
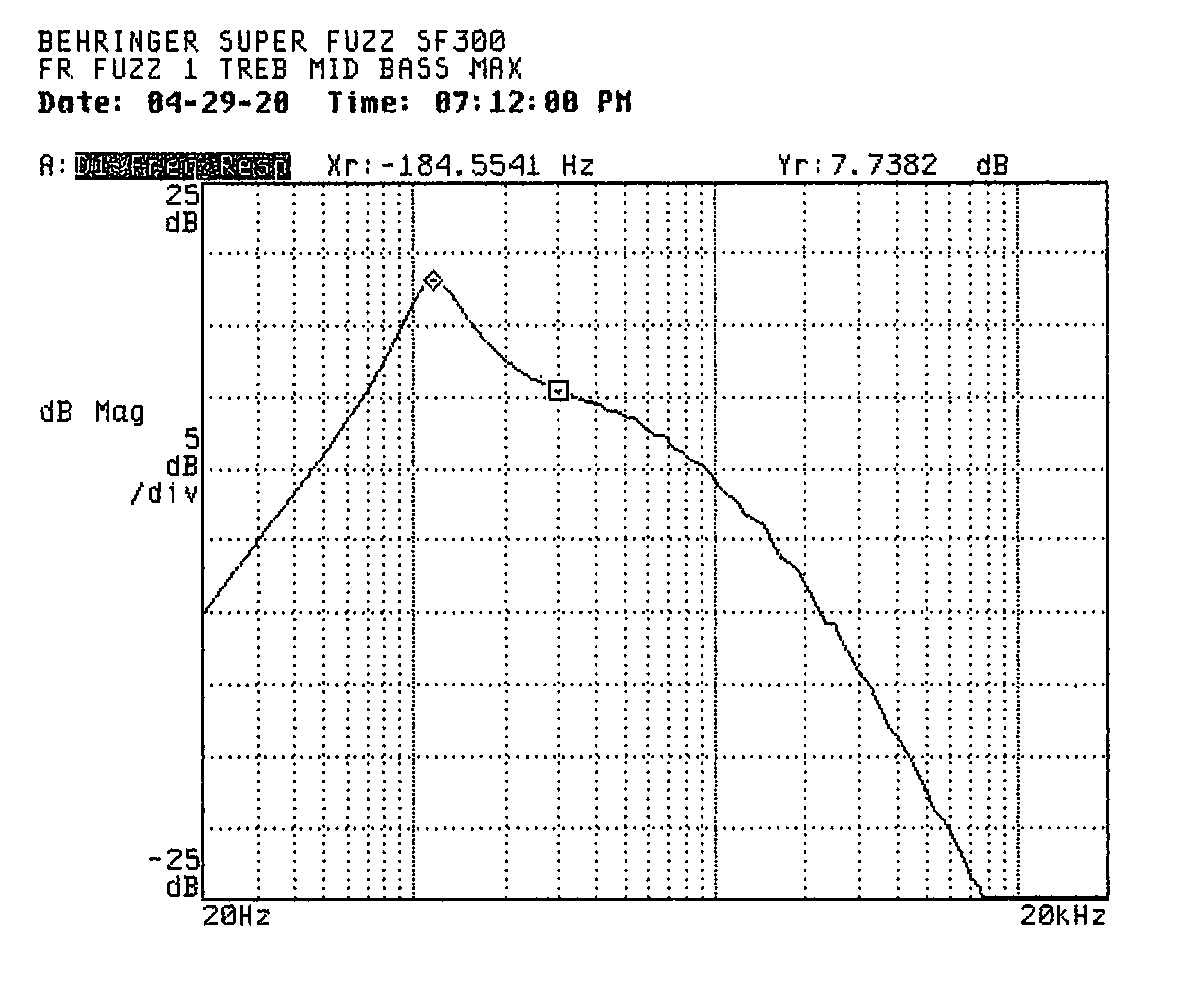
| Minimum | Maximum | +7.9 at 114 | 532 | F1MINMAX.DAT |
| Middle | Minimum | -9.8 at 114 | 819 | F1MIDMIN.DAT |
| Middle | Middle | — | 765 | F1MIDMID.DAT |
| Middle | Maximum | +7.7 at 116 | 622 | F1MIDMAX.DAT |
| Maximum | Minimum | -10 at 114 | 1,400 | F1MAXMIN.DAT |
| Maximum | Middle | — | 1,200 | F1MAXMID.DAT |
| Maximum | Maximum | +7.6 at 114 | 941 | F1MAXMAX.DAT |
| Treble | Bass | Low scoop/peak | High cutoff | Second treble peak |
|---|---|---|---|---|
| Minimum | Minimum | -6.5 dBVRMS at 116 Hz | 433 Hz | -24 dbVRMS at 2,000 Hz |
| Minimum | Middle | — | 317 | -28 at 2,000 |
| Minimum | Maximum | +11 at 116 | 397 | -26 at 2,700 |
| Middle | Minimum | -6.5 at 116 | 456 | -16 at 2,700 |
| Middle | Middle | — | 323 | -20 at 3,000 |
| Middle | Maximum | +11 at 112 | 397 | -18 at 2,900 |
| Maximum | Minimum | -6.5 at 116 | 488 | -7 at 3.8 |
| Maximum | Middle | — | 340 | -11 at 3,900 |
| Maximum | Maximum | +11 at 112 | 418 | -9.4 at 4,000 |
Fuzz 2 setting data files: F2MINMIN.DAT, F2MINMID.DAT, F2MINMAX.DAT, F2MIDMIN.DAT, F2MIDMID.DAT, F2MIDMAX.DAT, F2MAXMIN.DAT, F2MAXMID.DAT, F2MAXMAX.DAT
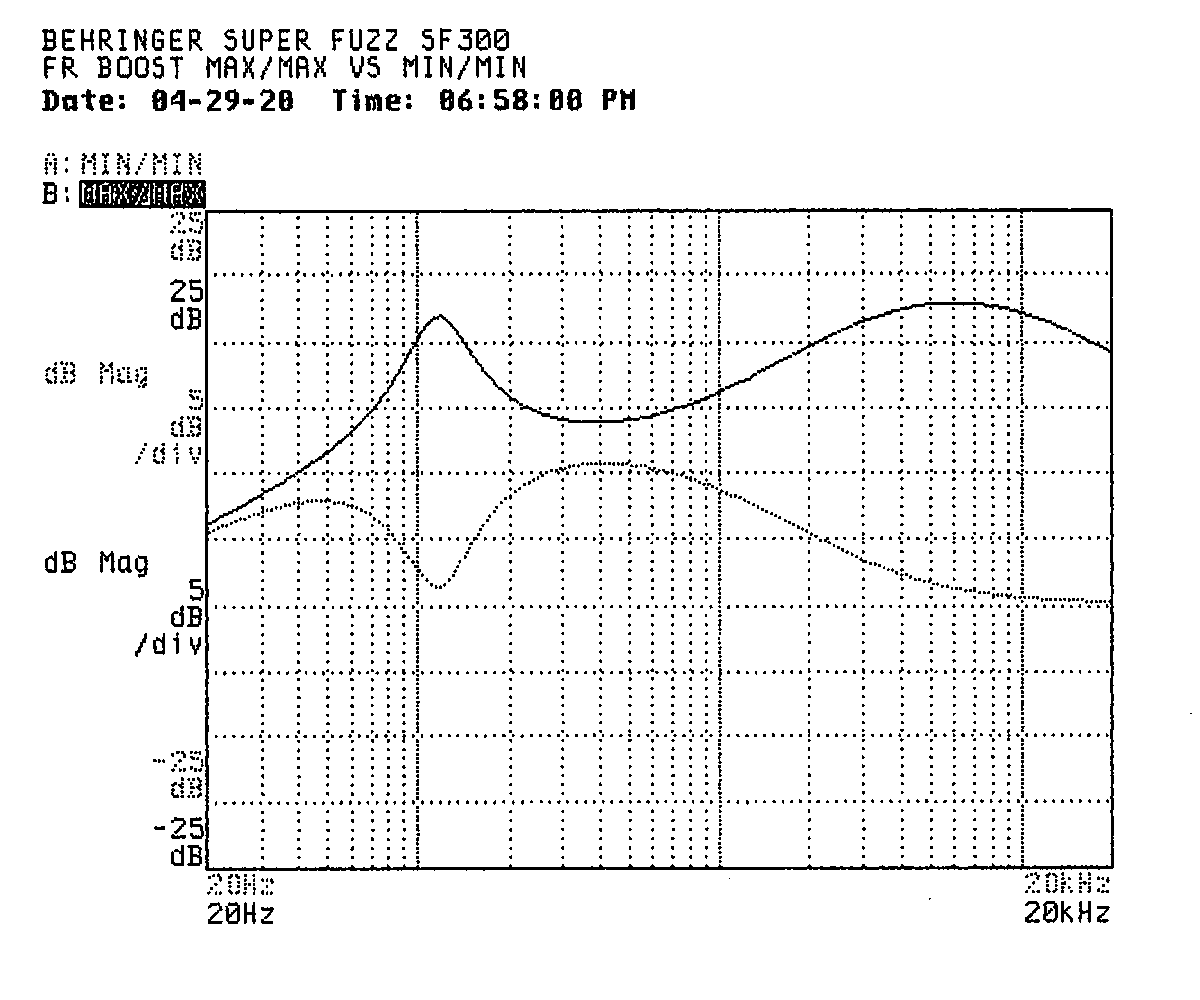
The frequency response plot below shows the bass scoop that can be achieved by setting the bass control to its minimum setting in Fuzz 1.
And this plot shows the peak that can be produced by setting it to its maximum setting in Fuzz 1.
The frequency response plot below shows the second treble peak characteristic of the Fuzz 2 setting.
In the Boost setting, both the treble and bass controls each seem to adjust a peak or scoop at about 6,200 Hz and 116 Hz respectively.
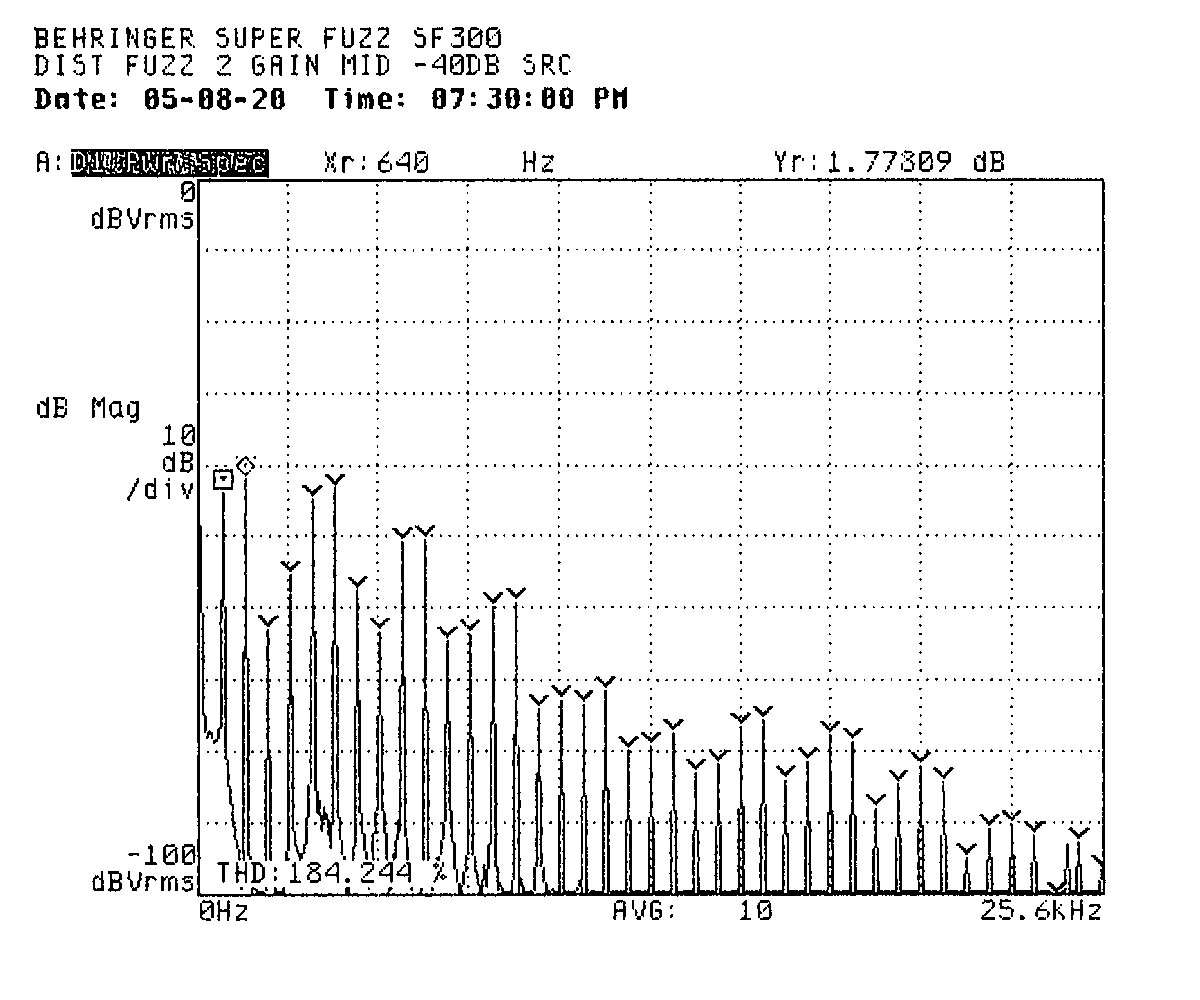
As for distortion, both the Fuzz 1 and Fuzz 2 settings show prominent second harmonics in particular and high even-order content in the distortion products more generally. At high input levels, both settings produce second harmonics that are a bit below the fundamental. As the input level falls off, the second harmonic overtakes the fundamental. At very low input levels, the fundamental once again dominates. There are some subtle differences between the two settings and at different gain levels, but this basic pattern holds across all of the settings I measured and seems to be characteristic to this type of fuzz effect. Overall, the most salient difference was that the Fuzz 1 setting had higher output than the Fuzz 2 setting at equal gain settings.
| Gain | Source | Fundamental | 2nd harmonic | Harmonic distortion | ||
|---|---|---|---|---|---|---|
| Even order | Odd order | Total | ||||
| Minimum | -60 dBVRMS | -52 dbVRMS | -72 dbVRMS | 11% | 0% | 11% |
| -40 | -33 | -34 | 93 | 6 | 93 | |
| -20 | -40 | -22 | 759 | 141 | 772 | |
| 0 | -31 | -24 | 228 | 144 | 269 | |
| 9 o'clock | -60 | -48 | -63 | 17 | 0 | 17 |
| -40 | -31 | -27 | 147 | 12 | 148 | |
| -20 | -37 | -22 | 528 | 139 | 546 | |
| 0 | -30 | -26 | 153 | 143 | 210 | |
| Middle | -60 | -44 | -55 | 29 | 1 | 29 |
| -40 | -34 | -24 | 298 | 31 | 299 | |
| -20 | -35 | -22 | 454 | 140 | 475 | |
| 0 | -29 | -27 | 139 | 132 | 192 | |
| Maximum | -60 | -31 | -30 | 115 | 8 | 115 |
| -40 | -38 | -22 | 644 | 139 | 659 | |
| -20 | -30 | -95 | 185 | 145 | 235 | |
| 0 | -28 | -27 | 121 | 118 | 168 | |
Fuzz 1 setting data files: D1A60.DAT, D1A40.DAT, D1A20.DAT, D1A0.DAT, D1B60.DAT, D1B40.DAT, D1B20.DAT, D1B0.DAT, D1C60.DAT, D1C40.DAT, D1C20.DAT, D1C0.DAT, D1D60.DAT, D1D40.DAT, D1D20.DAT, D1D0.DAT
| Gain | Source | Fundamental | 2nd harmonic | Harmonic distortion | ||
|---|---|---|---|---|---|---|
| Even order | Odd order | Total | ||||
| Minimum | -60 dBVRMS | -61 dbVRMS | -90 dbVRMS | 4% | 2% | 5% |
| -40 | -41 | -50 | 38 | 6 | 38 | |
| -20 | -48 | -38 | 568 | 487 | 748 | |
| 0 | -40 | -40 | 246 | 266 | 363 | |
| 9 o'clock | -60 | -56 | -79 | 7 | 1 | 7 |
| -40 | -39 | -43 | 63 | 23 | 68 | |
| -20 | -45 | -38 | 386 | 436 | 583 | |
| 0 | -38 | -42 | 216 | 229 | 315 | |
| Middle | -60 | -52 | -71 | 11 | 1 | 11 |
| -40 | -42 | -40 | 161 | 89 | 184 | |
| -20 | -43 | -35 | 337 | 407 | 529 | |
| 0 | -38 | -42 | 198 | 223 | 298 | |
| Maximum | -60 | -40 | -46 | 49 | 11 | 50 |
| -40 | -46 | -38 | 450 | 457 | 641 | |
| -20 | -39 | -41 | 231 | 237 | 331 | |
| 0 | -37 | -43 | 174 | 211 | 274 | |
Fuzz 2 setting data files: D2A60.DAT, D2A40.DAT, D2A20.DAT, D2A0.DAT, D2B60.DAT, D2B40.DAT, D2B20.DAT, D2B0.DAT, D2C60.DAT, D2C40.DAT, D2C20.DAT, D2C0.DAT, D2D60.DAT, D2D40.DAT, D2D20.DAT, D2D0.DAT
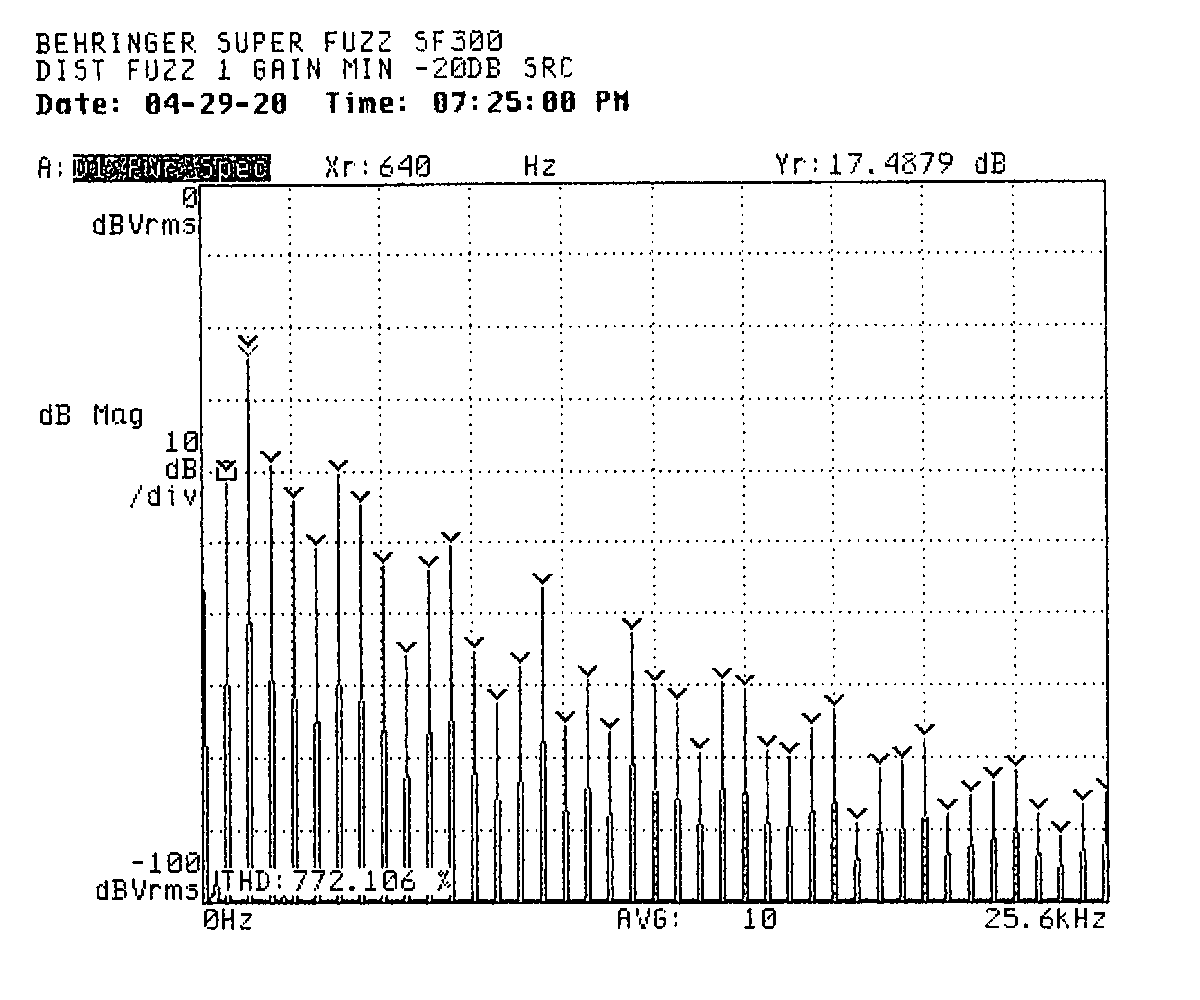
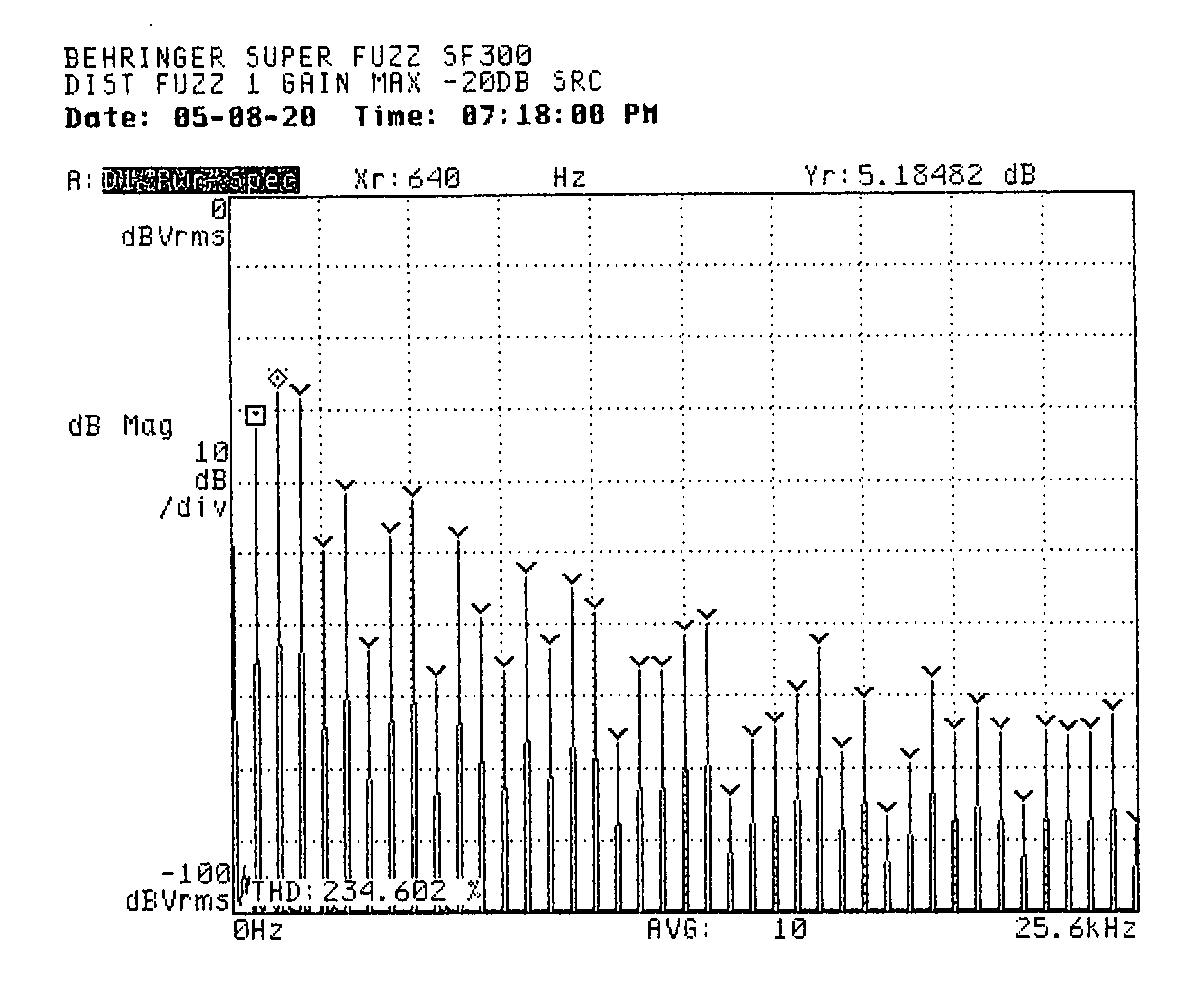
As gain is increased in the Fuzz 1 setting with moderate input signal strength, the fundamental comes up in power faster than the second harmonic. The net result is lower total harmonic distortion and a shift from mostly even-order distortion products to more balance between even- and odd-order products. This effect is present but less prominent also in the Fuzz 2 setting.
These two plots show the effect in Fuzz 1 setting with a source signal of -20 dBVRMS at minimum and maximum gain.
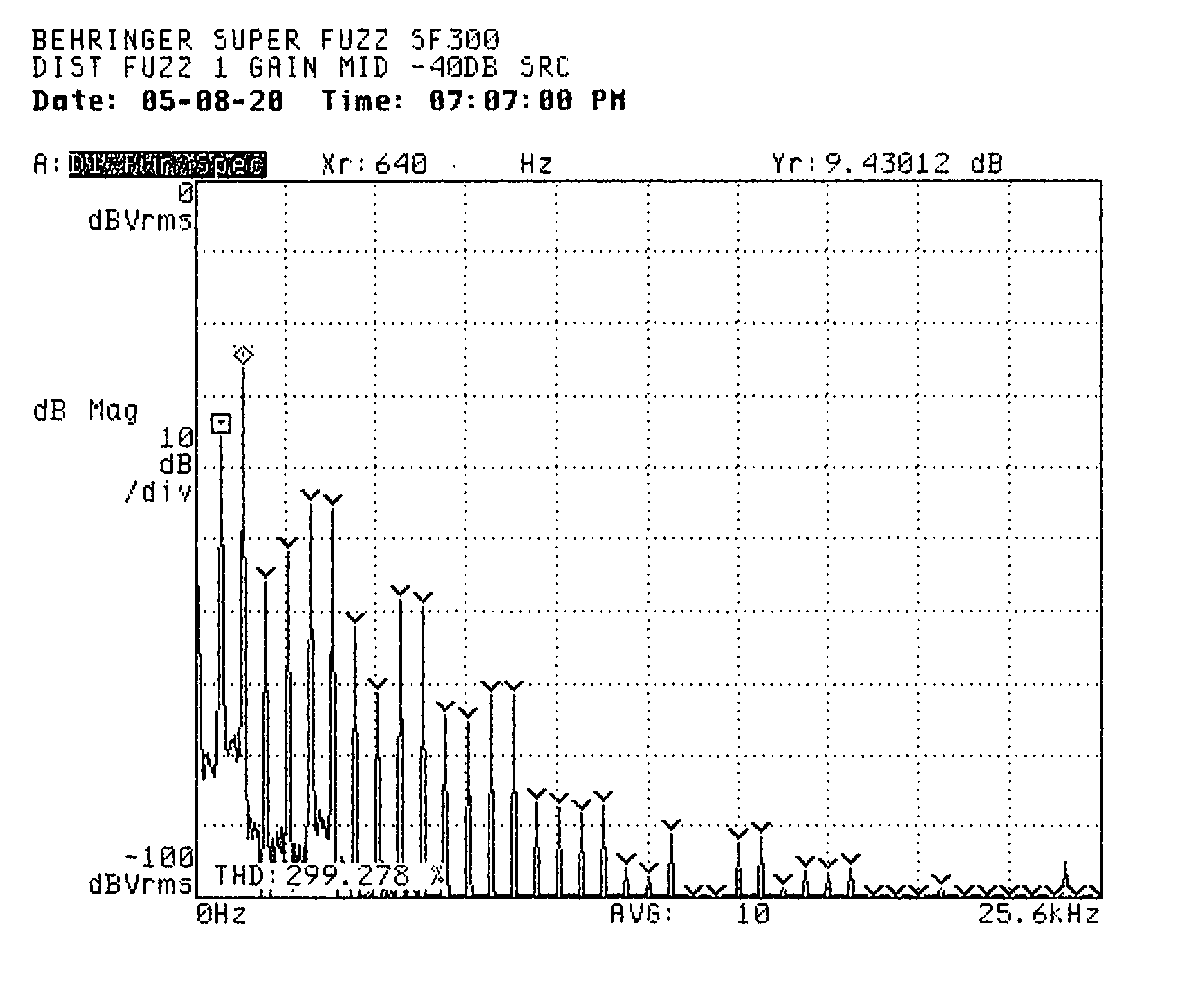
Switching from Fuzz 1 to Fuzz 2 has a similar (but not exactly the same, I guess) effect to increasing the gain setting, as these two plots show. Both were taken with the same gain setting and source signal. You can see a similar effect to the prior two plots where the fundamental comes up faster than the second harmonic, giving lower total harmonic distortion and more balance between even- and odd-order harmonic content.
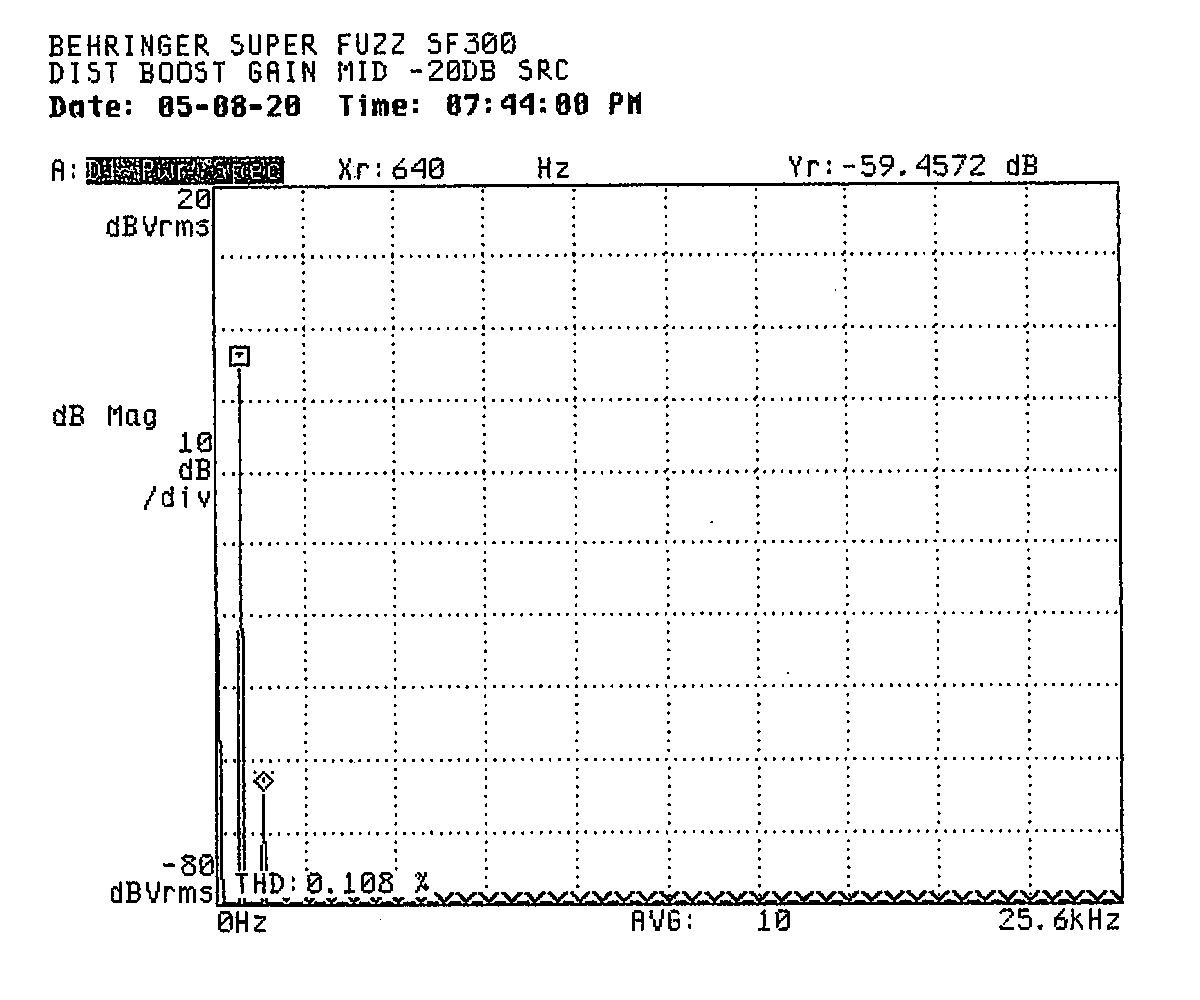
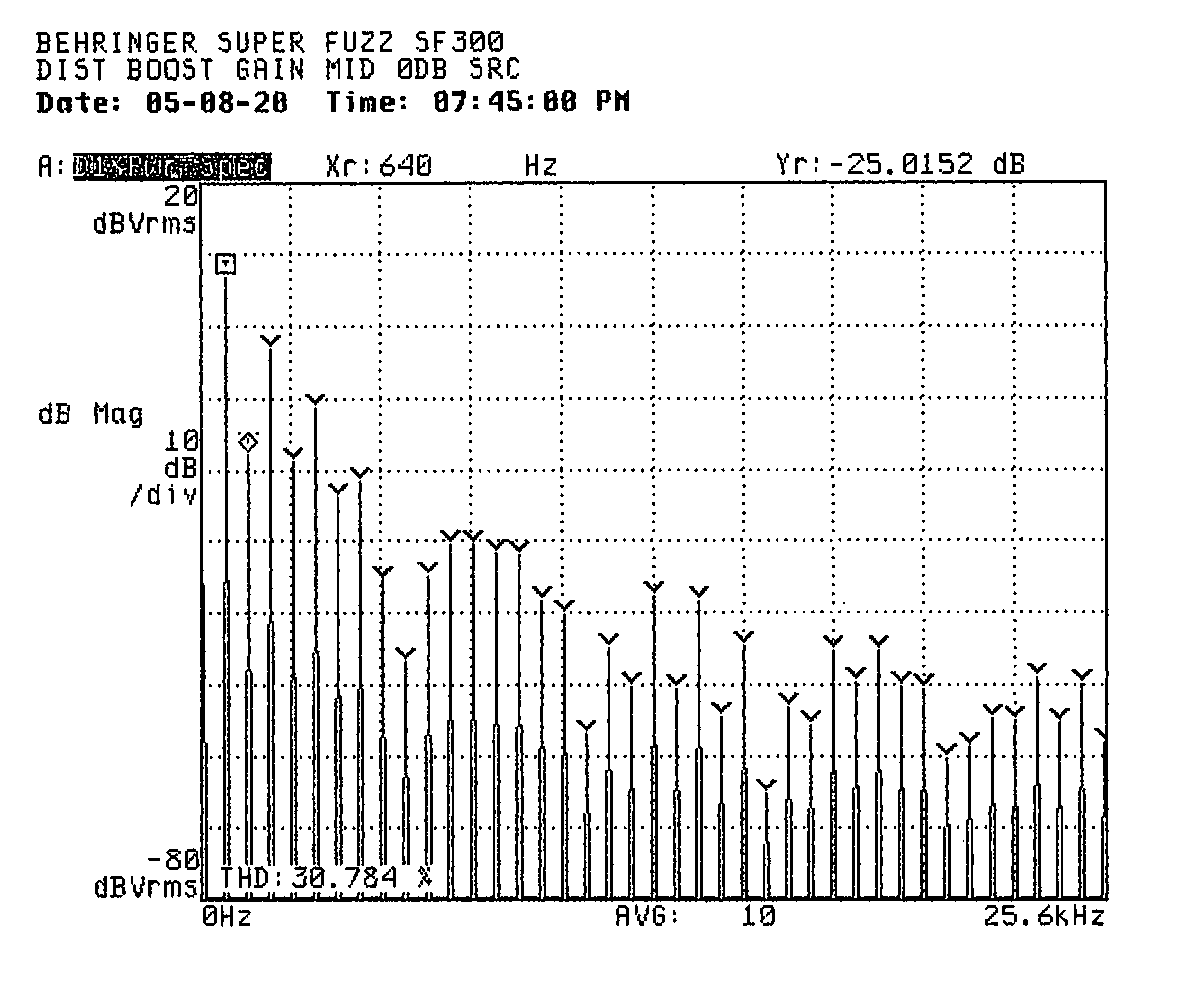
The boost mode is — as one might expect — completely different from the two fuzz modes. It produces essentially no distortion at reasonable source signal levels. At unreasonable source levels, it can be coaxed into distortion.
| Gain | Source | Fundamental | 2nd harmonic | Harmonic distortion | ||
|---|---|---|---|---|---|---|
| Even order | Odd order | Total | ||||
| Minimum | -60 dbVRMS | -51 dbVRMS | — | 1% | 1% | 2% |
| -40 | -32 | — | 0 | 0 | 0 | |
| -20 | -12 | — | 0 | 0 | 0 | |
| 0 | 7 | -27 dbVRMS | 2 | 2 | 3 | |
| Middle | -60 | -43 | — | 0 | 0 | 1 |
| -40 | -24 | — | 0 | 0 | 0 | |
| -20 | -4 | -63 | 0 | 0 | 0 | |
| 0 | 9 | -16 | 8 | 30 | 31 | |
| Maximum | -60 | -30 | — | 0 | 0 | 0 |
| -40 | -11 | -71 | 0 | 0 | 0 | |
| -20 | 8 | -23 | 3 | 9 | 9 | |
| 0 | 9 | -19 | 11 | 43 | 44 | |
Boost setting data files: DBA60.DAT, DBA40.DAT, DBA20.DAT, DBA0.DAT, DBC60.DAT, DBC40.DAT, DBC20.DAT, DBC0.DAT, DBD60.DAT, DBD40.DAT, DBD20.DAT, DBD0.DAT
Here's a plot showing the negligible distortion at reasonable source signal levels in the boost setting.
Contrast the preceding plot with this one showing distortion coming in on the boost setting as we get to unreasonably-high source signal levels.
While the balance of distortion products and the way they change with input level in the Fuzz 1 and Fuzz 2 settings is measurably different, the overall pattern is comparable: these do not seem to be two wildly different distortion techniques. I suspect that the difference in character noted by ear is due in part to the difference in distortion products but perhaps moreso to the relatively more pronounced differences in tone shaping between the two modes.
The boost is clean with what seem like thoughtful tone-shaping options. I suspect it would be handy for musicians who decide to park this pedal permanently at the front of their signal chain.
I hope you found this write-up interesting and helpful. If you have any questions or comments, please let me know! If this is the kind of thing you're into, you may enjoy our other work.
Aaron D. Parks