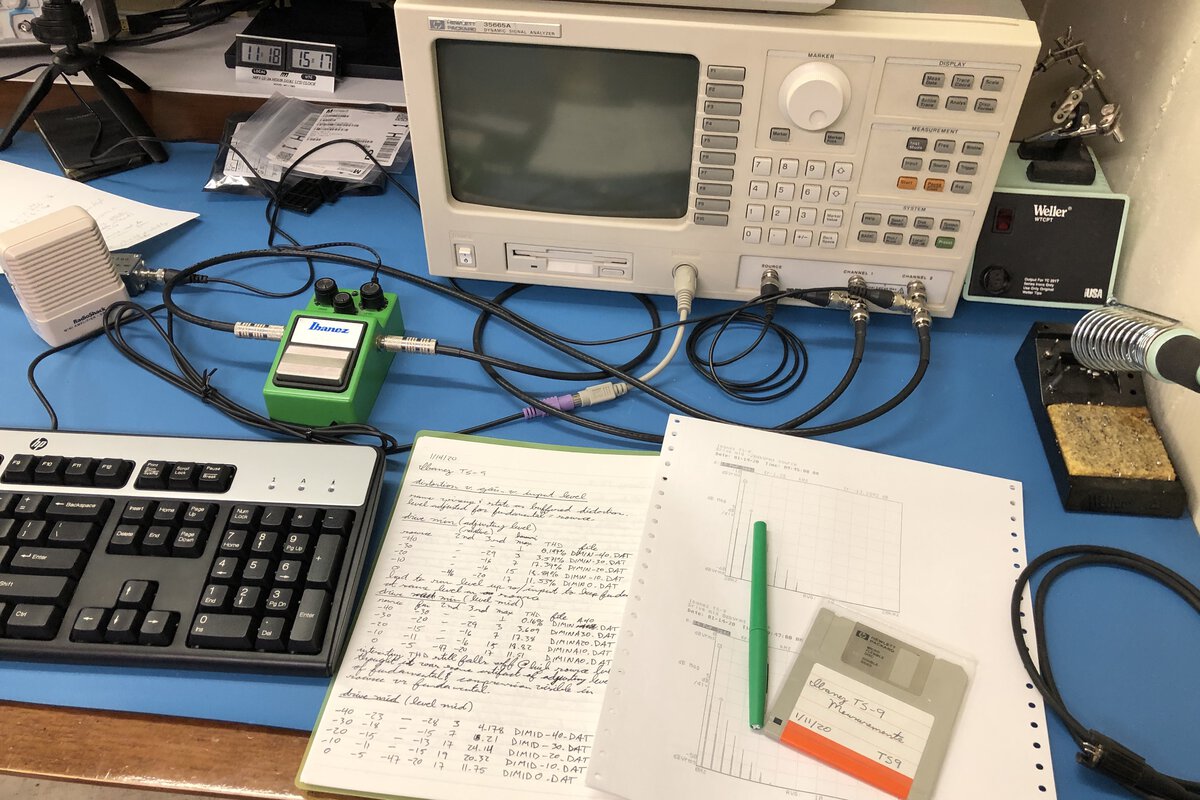
My brother and I have been talking about guitar effects pedals recently and we thought it would be interesting to hook some of them up to a dynamic signal analyzer and see what we could learn. First up was an Ibanez TS-9 Tube Screamer. I made swept-sine frequency response measurements as well as FFT harmonic distortion measurements to try to characterize some of the more salient features of this pedal.
I saved state and trace files from the DSA to disk along the way. I've included them here mostly for my own future reference, but if you have a way to work with HP DSA files you're welcome to check them out.
I made up a pair of BNC to quarter-inch cables along with a power cable for this project. The BNC cables make it easy to connect the pedal to the DSA and the power cable has banana plugs so I can power the pedal from a variable bench supply. For these measurements, the supply was locked in at 9 Volts. Channel 1 of the DSA was connected to the internal signal source and the input of the pedal. Channel 2 was connected to the output of the pedal and also to a small amplified speaker through a high-impedance pad.
For frequency response measurements, the DSA was configured to operate in swept-sine mode with a frequency range of 20-20,000Hz with a logarithmic sweep (typical settings for audio measurements). The source level was set to -40dBVRMS and the gain control on the pedal was set to minimum to help reduce the effect of distortion on the measurement (the swept-sine mode of the DSA is designed to reject noise and distortion, but I figured it couldn't hurt to be thorough). The level control on the pedal was set to the middle of its range and the tone control was varied to its minimum, middle, and maximum settings to capture a set of frequency response curves. The DSA state was saved as FREQRESP.STA.
For distortion measurements, the DSA was configure to operate in 2-channel FFT mode with a stop frequency of about 20kHz (it adjusts automatically to a nearby multiple of its sample clock rate). A second channel was not required for these measurements, but it made it easy to keep the same wiring setup as for the frequency response measurements. The DSA's internal signal source was configured for fixed-sine mode at a frequency of 640Hz. This frequency was selected because it's near the bottom of the pedal's pass-band (with the tone control at max, which it was for these measurements) and because it's a multiple of the DSA's time record size. Because the source frequency was a multiple of the time record size, I was able to use the uniform input filter, which provides better frequency resolution. I was also able to use source triggering, which in turn enabled the use of vector averaging (10 averages in this case) which lowers the effective noise floor. Since the output of the pedal is connected to channel 2, we'll be looking at channel 2 power spectrum measurements. The vertical scale for all plots is 5dB per division and the upper bound of the plot is managed by input range tracking. The input range was auto-scaled with each change in source level. The pedal's level output was set to mid-range. I used the DSA's marker function to calculate total harmonic distortion (THD). The DSA state for distortion measurements was saved as DISTORTN.STA.
I'm interested in making comprehensive measurements to characterize different pickup types in different configurations and with different volume and tone settings, but I haven't yet. I relied on information from the Internet to guide my selection of source levels. In particular, an article at Tom's Guitar Projects seemed well-researched and gave a reasonably comprehensive overview of the output from different pickup types in different playing conditions.
I took a baseline frequency response sweep with the pedal in buffered bypass mode. It was flat with the exception of blocking DC with a high-pass filter having measured -3dB frequency of 23Hz. 20Hz is probably the design frequency for the DC-blocking filter; that's typical for audio applications. This trace was saved as FRBUF.DAT.
I turned the pedal on and took frequency response sweeps with the tone control set to minimum, midrange, and maximum. In each case, the sweep showed a band-pass filter response. I produced two prints: one with the frequency response at maximum tone setting in the foreground with the midrange tone setting frequency response in the background and one with the minimum tone plotted in the foreground against the midrange tone setting in the background.
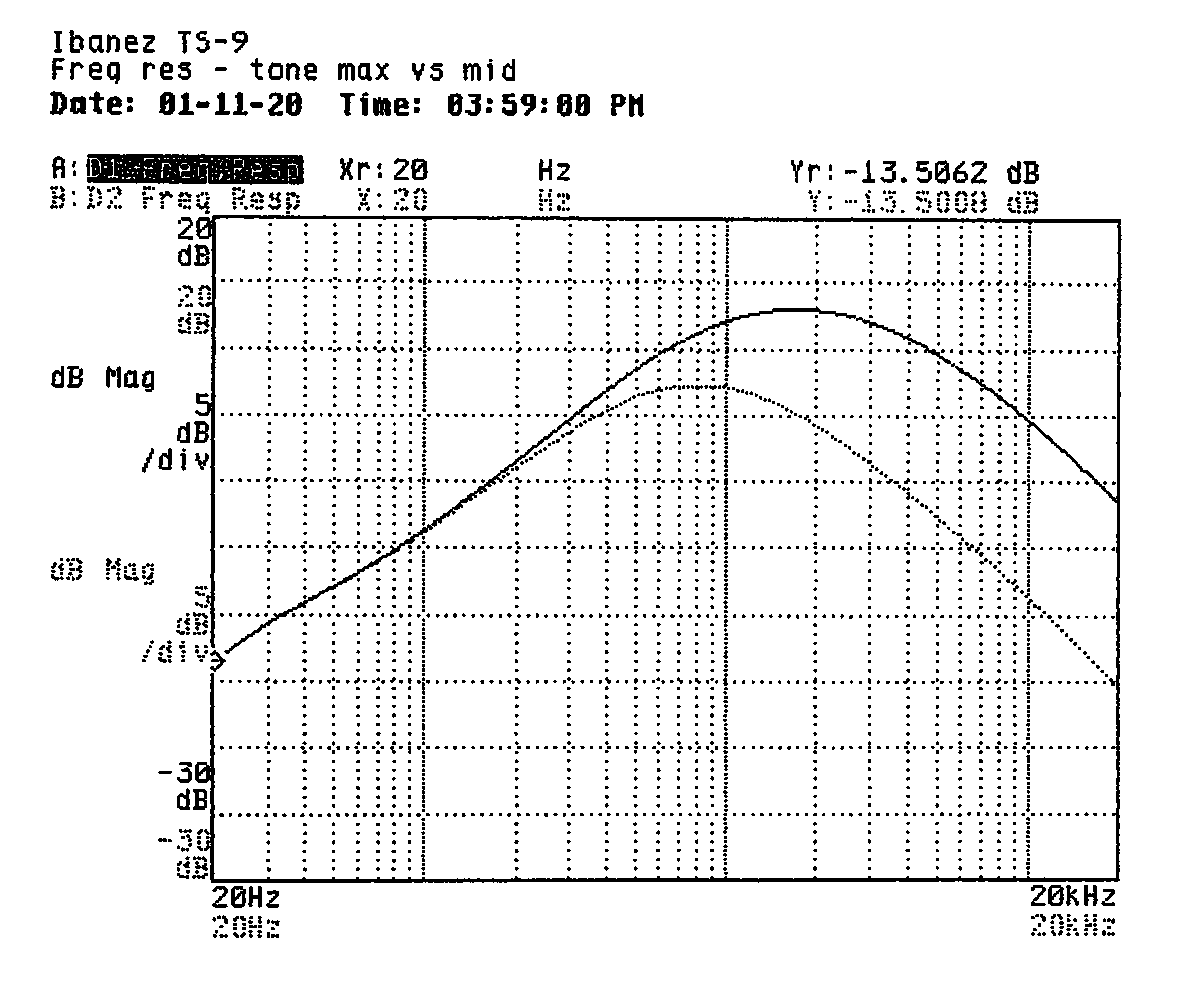
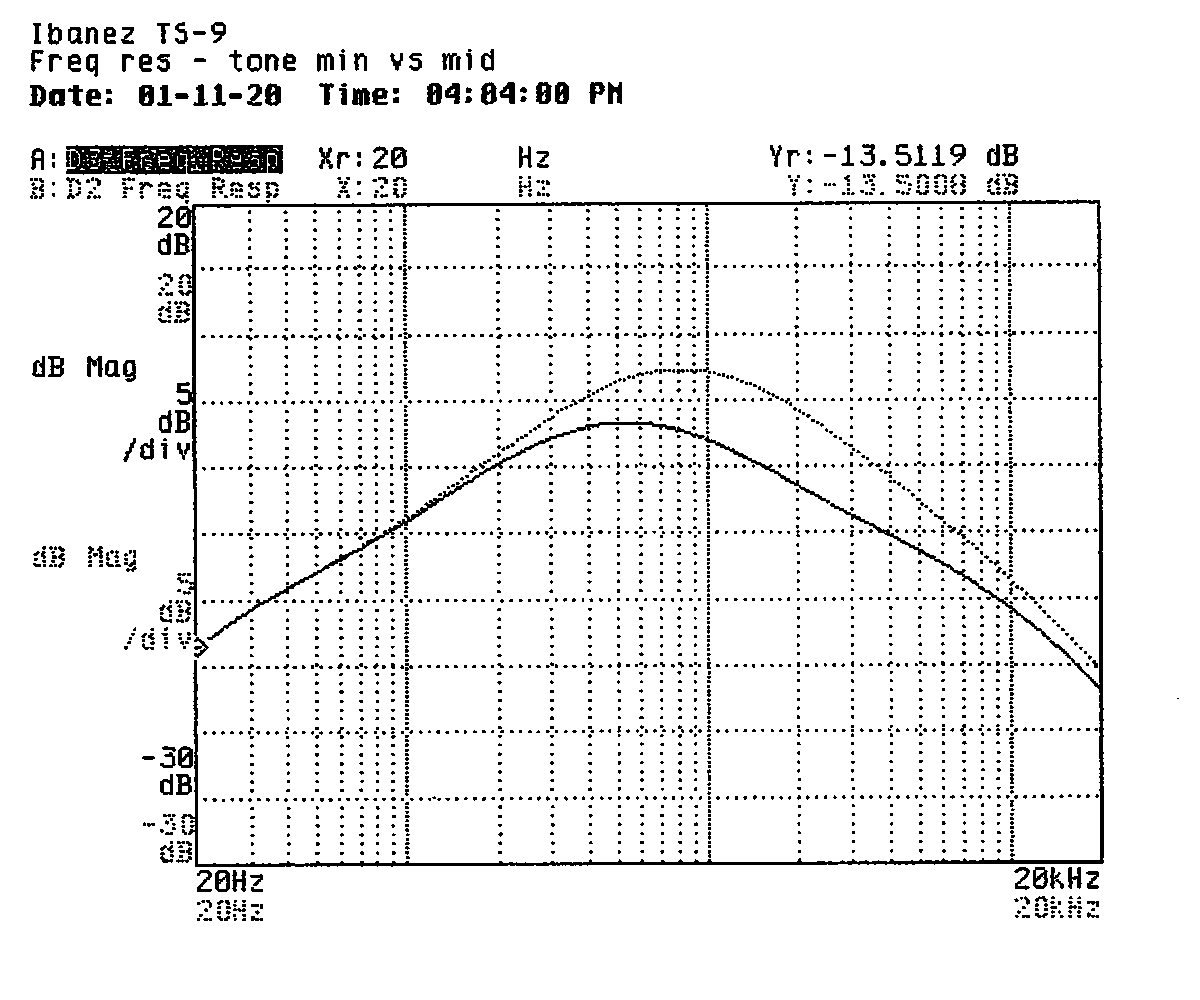
I pulled some numbers off the curves to help characterize the band-pass filter. I've summarized them in the following table. The low-pass side of the filter skirt falls off at about 5dB per octave while the high-pass side falls off at closer to 6dB per octave.
| Tone control | Lower corner | Upper corner | Peak response | File |
|---|---|---|---|---|
| Maximum | 643Hz | 4,770Hz | 13dB | FRTONMAX.DAT |
| Middle | 328Hz | 2,000Hz | 7.5dB | FRTONMID.DAT |
| Minimum | 205Hz | 1,449Hz | 3.5dB | FRTONMIN.DAT |
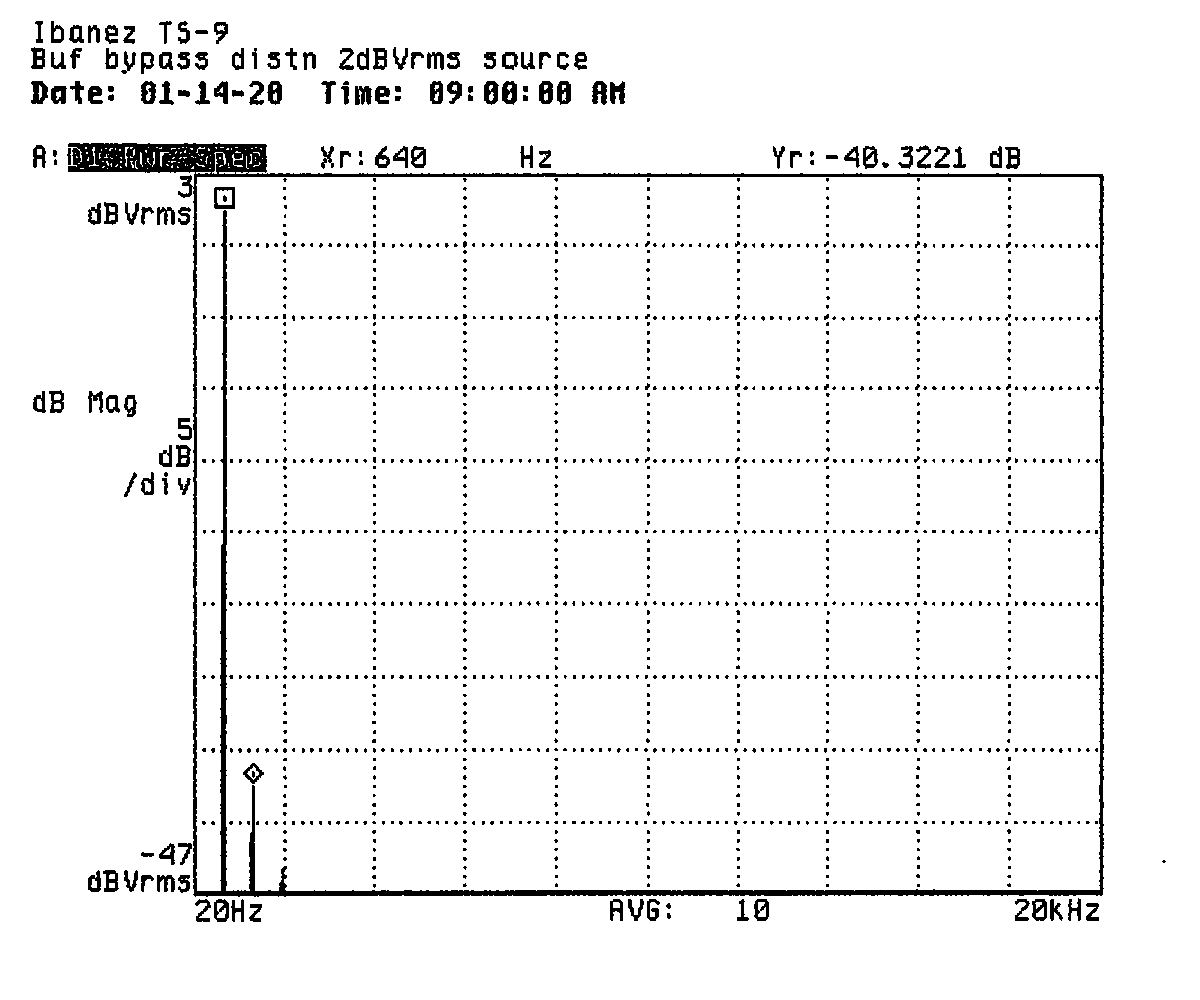
As with the frequency response measurements, I started first with the pedal in buffered bypass mode. As expected, no significant distortion was present until the source level was very high (I think higher than you'd get out of any guitar pickup). Total harmonic distortion at increasing source levels is summarized in the table and shown in the print below.
| Source | THD | File |
|---|---|---|
| -40dbVRMS | 0.051% | DIBUF-40.DAT |
| -30 | 0.015 | DIBUF-30.DAT |
| -20 | 0.033 | DIBUF-20.DAT |
| -10 | 0.117 | DIBUF-10.DAT |
| 0 | 0.525 | DIBUF0.DAT |
| 2 | 1.095 | DIBUF2.DAT |
| 5 | 11.75 | DIBUF5.DAT |
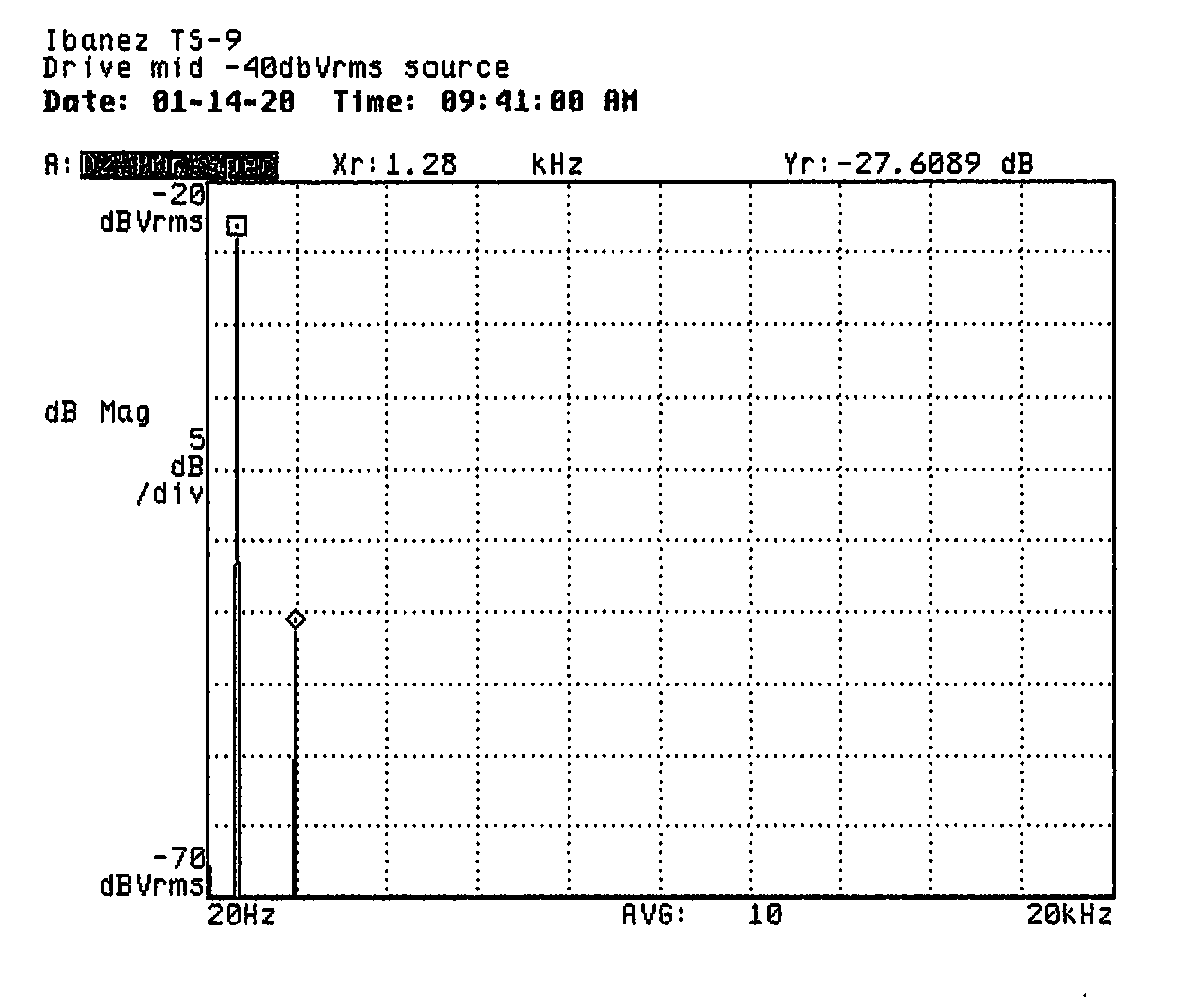
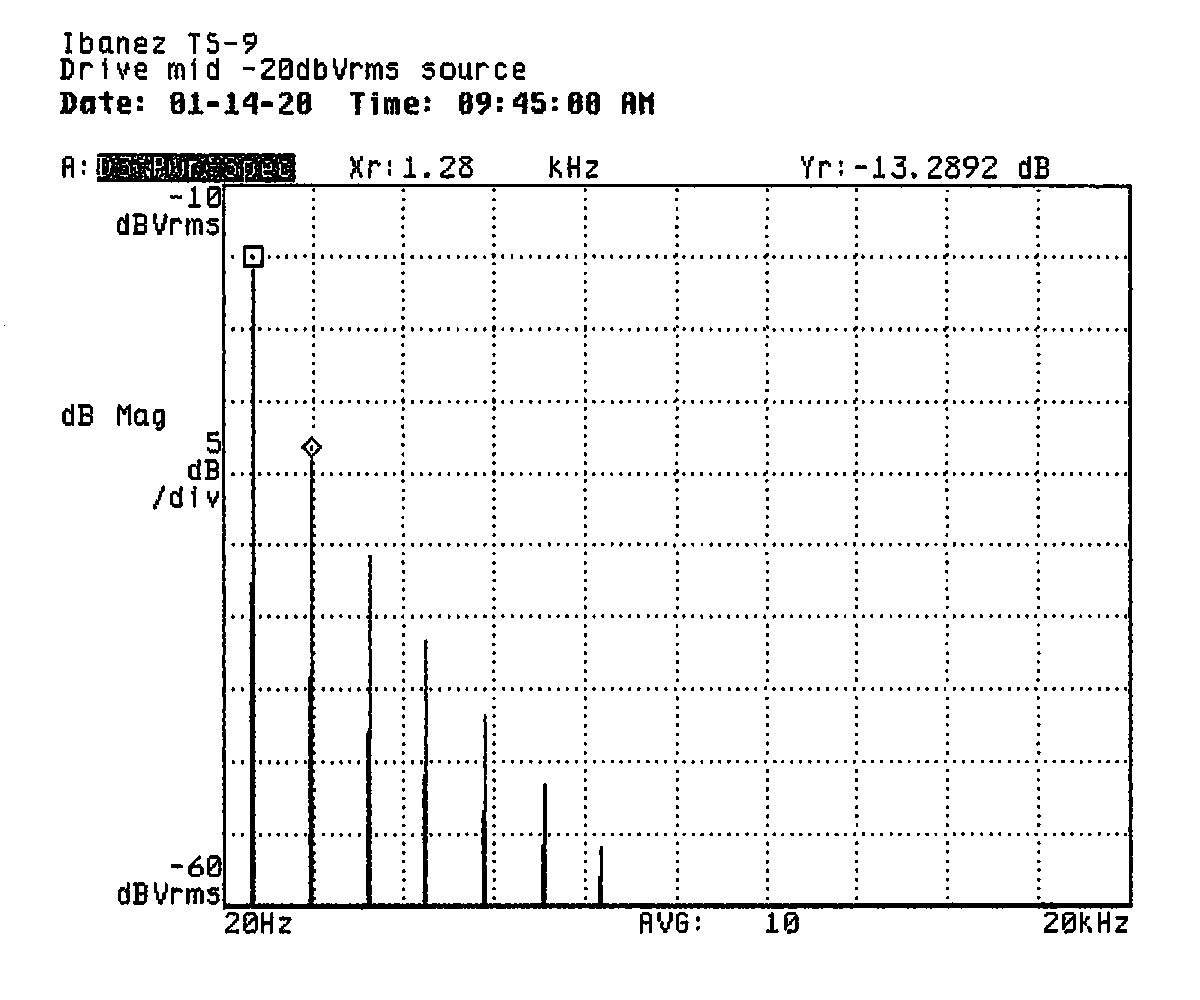
With the pedal turned on, I took measurements at varying source levels with the gain control adjusted to minimum, midrange, and maximum. The tone control was set to maximum ("wide open" in this case) and the level control was placed at midrange (brief experimentation showed that it didn't seem to affect the measurements, as expected). The tables and prints below summarize the measurements. The tables include the pedal's drive control setting, source level, 2nd harmonic power relative to fundamental power, 3rd harmonic power relative to fundamental power, highest harmonic order show on print (vertical range is 50dB), total harmonic distortion, and the trace data file.
| Source | Fundamental | 2nd | 3rd | Highest | THD | File |
|---|---|---|---|---|---|---|
| -40dBVRMS | -30dB | — | — | 1 | 0.160% | DIMINA40.DAT |
| -30 | -20 | — | -29dB | 3 | 3.609 | DIMINA30.DAT |
| -20 | -15 | — | -16 | 7 | 17.38 | DIMINA20.DAT |
| -10 | -11 | — | -16 | 15 | 18.82 | DIMINA10.DAT |
| 0 | -5 | -47dB | -20 | 17 | 11.51 | DIMINA0.DAT |
| Source | Fundamental | 2nd | 3rd | Highest | THD | File |
|---|---|---|---|---|---|---|
| -40dBVRMS | -23dB | — | -28dB | 3 | 4.178% | DIMID-40.DAT |
| -30 | -18 | — | -15 | 7 | 18.21 | DIMID-30.DAT |
| -20 | -15 | — | -13 | 17 | 24.14 | DIMID-20.DAT |
| -10 | -11 | — | -15 | 19 | 20.32 | DIMID-10.DAT |
| 0 | -5 | -47dB | -20 | 17 | 11.75 | DIMID0.DAT |
| Source | Fundamental | 2nd | 3rd | Highest | THD | File |
|---|---|---|---|---|---|---|
| -40dbVRMS | -19dB | -41dB | -14dB | 11 | 20.97% | DIMAX-40.DAT |
| -30 | -17 | -51 | -12 | 17 | 26.48 | DIMAX-30.DAT |
| -20 | -15 | — | -13 | 21 | 26.41 | DIMAX-20.DAT |
| -10 | -11 | — | -15 | 21 | 20.79 | DIMAX-10.DAT |
| 0 | -5 | -47 | -20 | 17 | 11.82 | DIMAX0.DAT |
The DC-blocking filter is probably out front of the entire circuit and likely does not contribute much to the overall frequency response when the pedal is on. From the frequency response, I'm guessing there are probably two single-pole filters after the distortion circuit: a fixed-frequency high-pass filter with a corner frequency around or above 640Hz and a variable-frequency low-pass filter with a corner frequency adjustable between about 1,500Hz and 4,800Hz.
This filter arrangement is likely easy to design an economical to build, but it does have the downside of providing variable output level as the tone control is adjusted. This can be compensated adequately with the level control, but it requires two adjustments instead of one if you'd like to adjust the frequency response while keeping the output level steady.
In buffered bypass mode, the TS-9 has no appreciable distortion at expected source levels and has unity gain regardless of control settings. This, along with the flat frequency response makes me think it should be very transparent unless following effects depend on the output impedance of a guitar pickup as part of their circuit (as I think some simpler designs may).
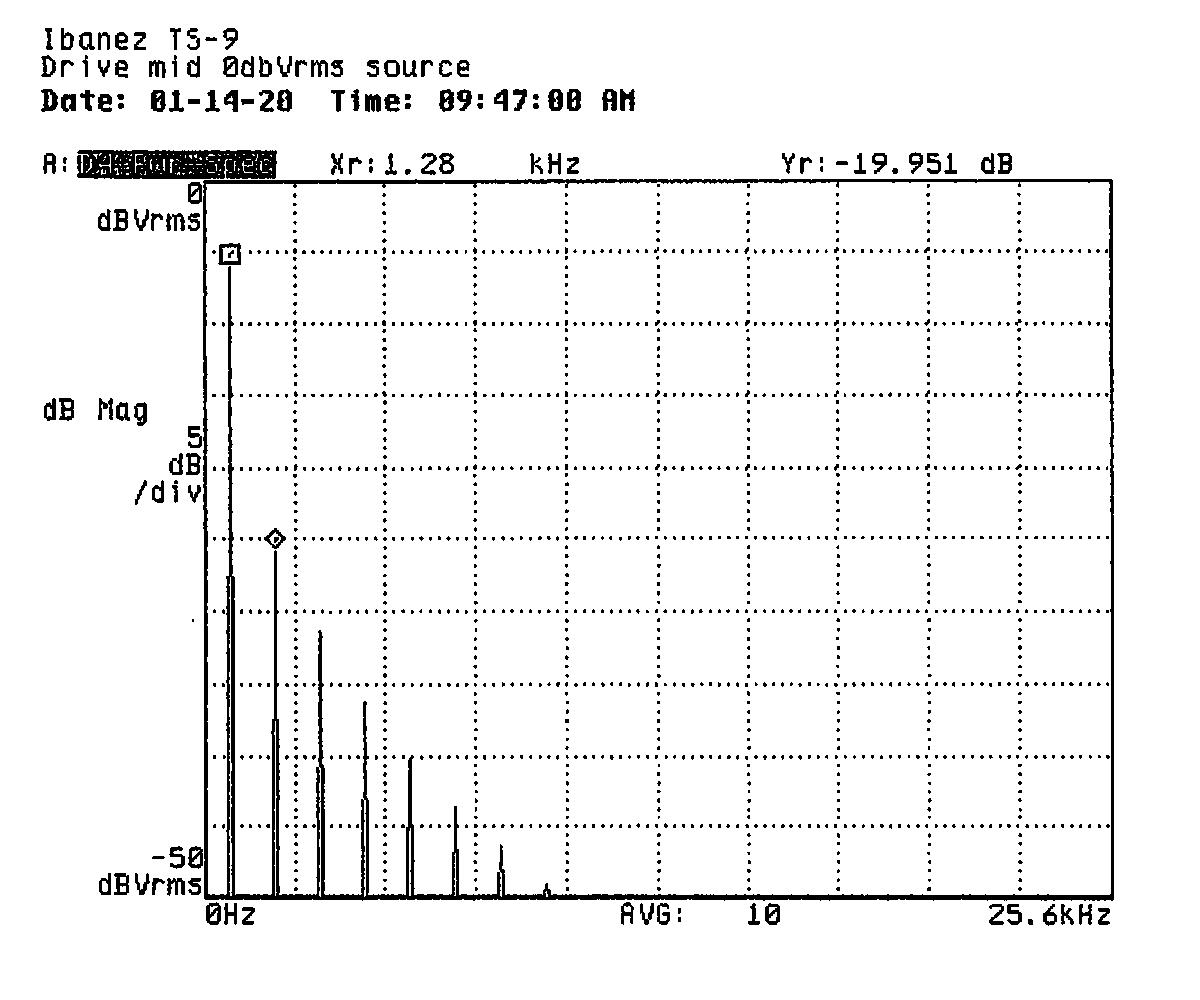
I thought it was interesting to see the relationship between source level and fundamental level in the distortion measurements. The expected compression effect is evident in the data: we see decreasing gain in the fundamental as the input level climbs. At the same time, we notice that the overall power of the harmonic content decreases relative to the stronger fundamental. From this, I imagine that the distortion circuit has a fixed level for its clipped output such that the increased level of the fundamental is principally responsible for the relative change.
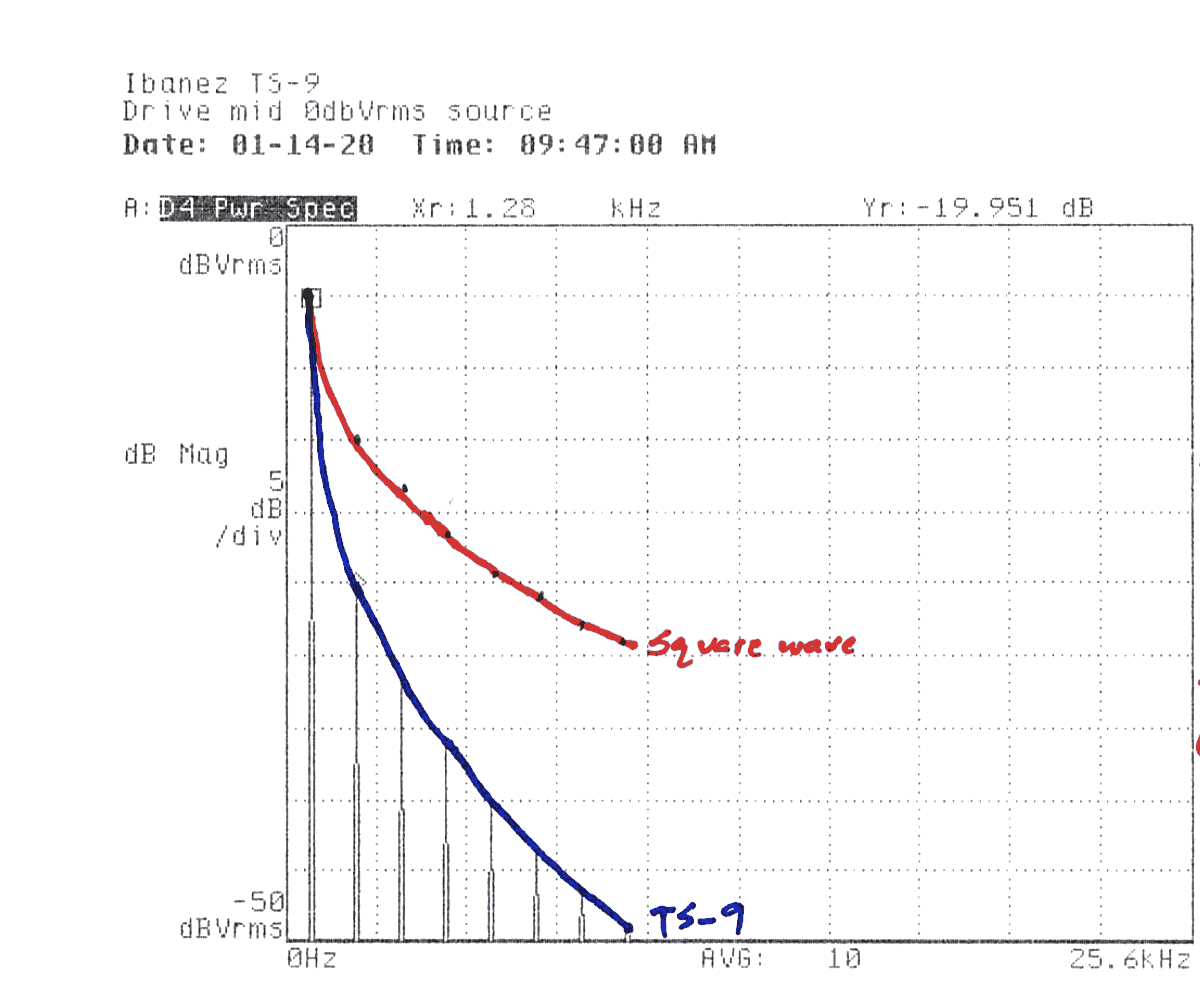
Along with the decrease in total harmonic power, however, we can note an increase in harmonic content (a greater number of harmonics present in the plots and less fall-off from one harmonic to the next). I imagine this is due to the clipping circuit being driven harder by the higher source level, causing its output to more closely approximate a square wave. Finally, we can notice that the harmonic content is almost exclusively odd-ordered, suggesting that the distortion circuit produces symmetrical output.
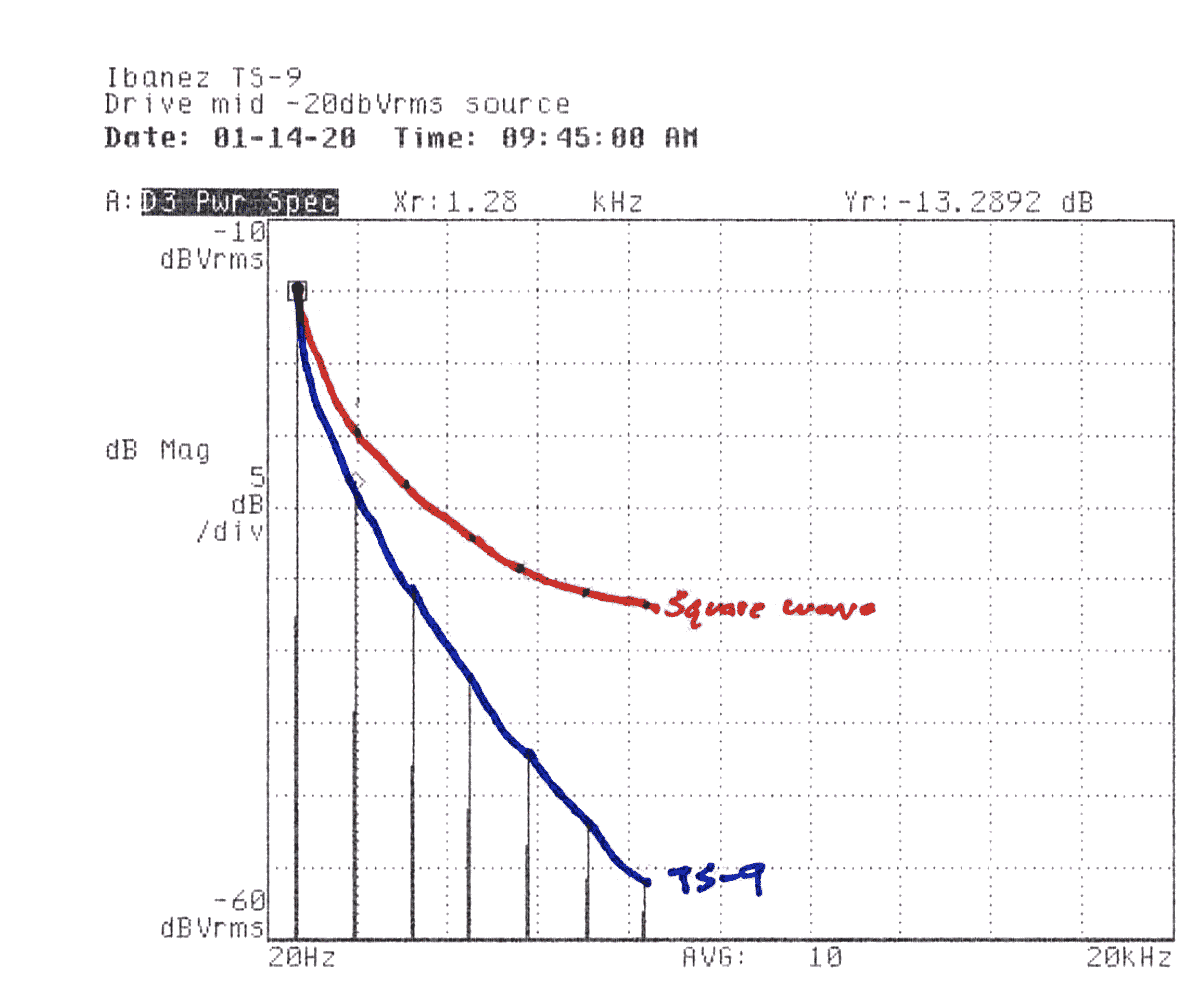
I marked up a couple of the prints from earlier to show where I would expect the harmonics of a perfect square wave to fall as compared to the measured harmonics. You can see that in both cases, so-called “soft clipping” produces less harmonic content than would be carried by a square wave, but that in the second case where the source level is higher, the overall harmonic content is increased (though relatively lower in level than the fundamental, as noted) and falls off less sharply as the harmonic order increases.
In summary, the Ibanez TS-9 Tube Screamer appears to be a competently executed overdrive style distortion effect with soft clipping, an adjustable (though somewhat unsophisicated) mid-hump frequency response, and buffered bypass. Qualitatively, I can note that the enclosure seems very robust (the sample used appears to have some miles on it, to no ill effect) with thoughtfully laid-out controls.
I hope you found this write-up interesting and helpful. If you have any questions or comments, please let me know! If this is the kind of thing you're into, you may enjoy our other work.
Aaron D. Parks